Immigrants from Uzbekistan vs Immigrants from Mexico Median Household Income
COMPARE
Immigrants from Uzbekistan
Immigrants from Mexico
Median Household Income
Median Household Income Comparison
Immigrants from Uzbekistan
Immigrants from Mexico
$86,425
MEDIAN HOUSEHOLD INCOME
70.1/ 100
METRIC RATING
159th/ 347
METRIC RANK
$73,160
MEDIAN HOUSEHOLD INCOME
0.0/ 100
METRIC RATING
297th/ 347
METRIC RANK
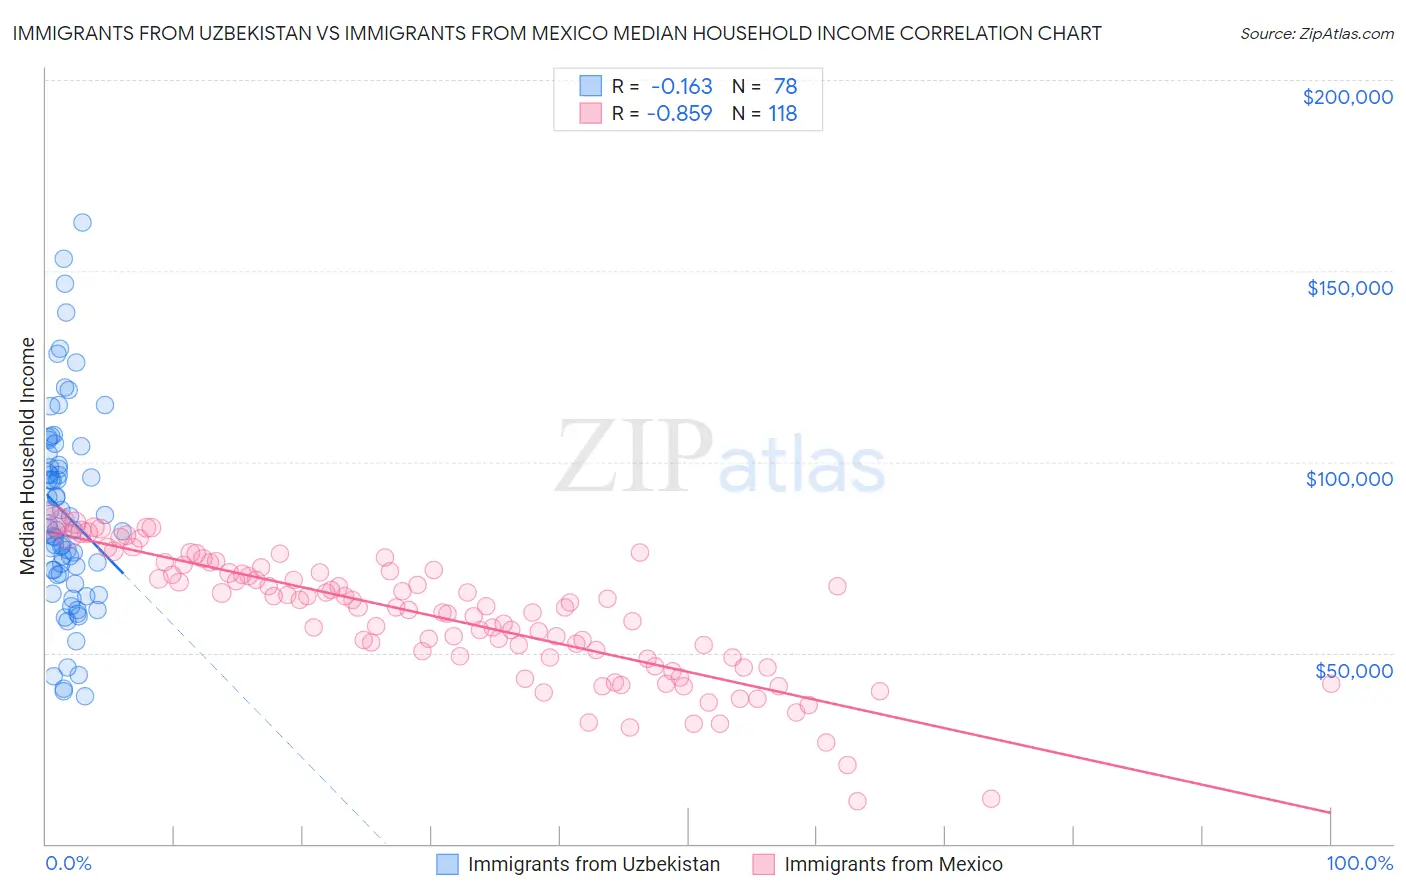
Immigrants from Uzbekistan vs Immigrants from Mexico Median Household Income Correlation Chart
The statistical analysis conducted on geographies consisting of 118,697,926 people shows a poor negative correlation between the proportion of Immigrants from Uzbekistan and median household income in the United States with a correlation coefficient (R) of -0.163 and weighted average of $86,425. Similarly, the statistical analysis conducted on geographies consisting of 513,131,801 people shows a very strong negative correlation between the proportion of Immigrants from Mexico and median household income in the United States with a correlation coefficient (R) of -0.859 and weighted average of $73,160, a difference of 18.1%.
Median Household Income Correlation Summary
| Measurement | Immigrants from Uzbekistan | Immigrants from Mexico |
| Minimum | $38,670 | $11,125 |
| Maximum | $162,808 | $84,609 |
| Range | $124,138 | $73,484 |
| Mean | $86,352 | $59,423 |
| Median | $82,168 | $61,801 |
| Interquartile 25% (IQ1) | $70,322 | $48,735 |
| Interquartile 75% (IQ3) | $99,228 | $71,471 |
| Interquartile Range (IQR) | $28,906 | $22,736 |
| Standard Deviation (Sample) | $26,082 | $16,352 |
| Standard Deviation (Population) | $25,914 | $16,282 |
Similar Demographics by Median Household Income
Demographics Similar to Immigrants from Uzbekistan by Median Household Income
In terms of median household income, the demographic groups most similar to Immigrants from Uzbekistan are Luxembourger ($86,418, a difference of 0.010%), Slavic ($86,398, a difference of 0.030%), Moroccan ($86,468, a difference of 0.050%), Samoan ($86,498, a difference of 0.080%), and Immigrants from Albania ($86,534, a difference of 0.13%).
| Demographics | Rating | Rank | Median Household Income |
| Immigrants | Saudi Arabia | 75.8 /100 | #152 | Good $86,875 |
| South Americans | 75.1 /100 | #153 | Good $86,824 |
| Immigrants | Germany | 74.4 /100 | #154 | Good $86,764 |
| Carpatho Rusyns | 72.8 /100 | #155 | Good $86,635 |
| Immigrants | Albania | 71.5 /100 | #156 | Good $86,534 |
| Samoans | 71.0 /100 | #157 | Good $86,498 |
| Moroccans | 70.6 /100 | #158 | Good $86,468 |
| Immigrants | Uzbekistan | 70.1 /100 | #159 | Good $86,425 |
| Luxembourgers | 70.0 /100 | #160 | Good $86,418 |
| Slavs | 69.7 /100 | #161 | Good $86,398 |
| Guamanians/Chamorros | 67.7 /100 | #162 | Good $86,255 |
| Czechs | 66.4 /100 | #163 | Good $86,164 |
| Irish | 66.2 /100 | #164 | Good $86,145 |
| Norwegians | 65.3 /100 | #165 | Good $86,084 |
| Scandinavians | 65.1 /100 | #166 | Good $86,073 |
Demographics Similar to Immigrants from Mexico by Median Household Income
In terms of median household income, the demographic groups most similar to Immigrants from Mexico are Haitian ($73,306, a difference of 0.20%), Paiute ($72,959, a difference of 0.27%), Cuban ($73,392, a difference of 0.32%), Indonesian ($72,856, a difference of 0.42%), and Blackfeet ($73,509, a difference of 0.48%).
| Demographics | Rating | Rank | Median Household Income |
| Bangladeshis | 0.1 /100 | #290 | Tragic $74,112 |
| Hispanics or Latinos | 0.1 /100 | #291 | Tragic $73,823 |
| Comanche | 0.1 /100 | #292 | Tragic $73,747 |
| Immigrants | Cabo Verde | 0.1 /100 | #293 | Tragic $73,515 |
| Blackfeet | 0.1 /100 | #294 | Tragic $73,509 |
| Cubans | 0.1 /100 | #295 | Tragic $73,392 |
| Haitians | 0.1 /100 | #296 | Tragic $73,306 |
| Immigrants | Mexico | 0.0 /100 | #297 | Tragic $73,160 |
| Paiute | 0.0 /100 | #298 | Tragic $72,959 |
| Indonesians | 0.0 /100 | #299 | Tragic $72,856 |
| Immigrants | Dominica | 0.0 /100 | #300 | Tragic $72,760 |
| Cherokee | 0.0 /100 | #301 | Tragic $72,682 |
| Shoshone | 0.0 /100 | #302 | Tragic $72,660 |
| Africans | 0.0 /100 | #303 | Tragic $72,650 |
| Immigrants | Haiti | 0.0 /100 | #304 | Tragic $72,599 |