Ethiopian vs Immigrants from Sudan Median Household Income
COMPARE
Ethiopian
Immigrants from Sudan
Median Household Income
Median Household Income Comparison
Ethiopians
Immigrants from Sudan
$89,640
MEDIAN HOUSEHOLD INCOME
94.9/ 100
METRIC RATING
121st/ 347
METRIC RANK
$79,103
MEDIAN HOUSEHOLD INCOME
2.1/ 100
METRIC RATING
242nd/ 347
METRIC RANK
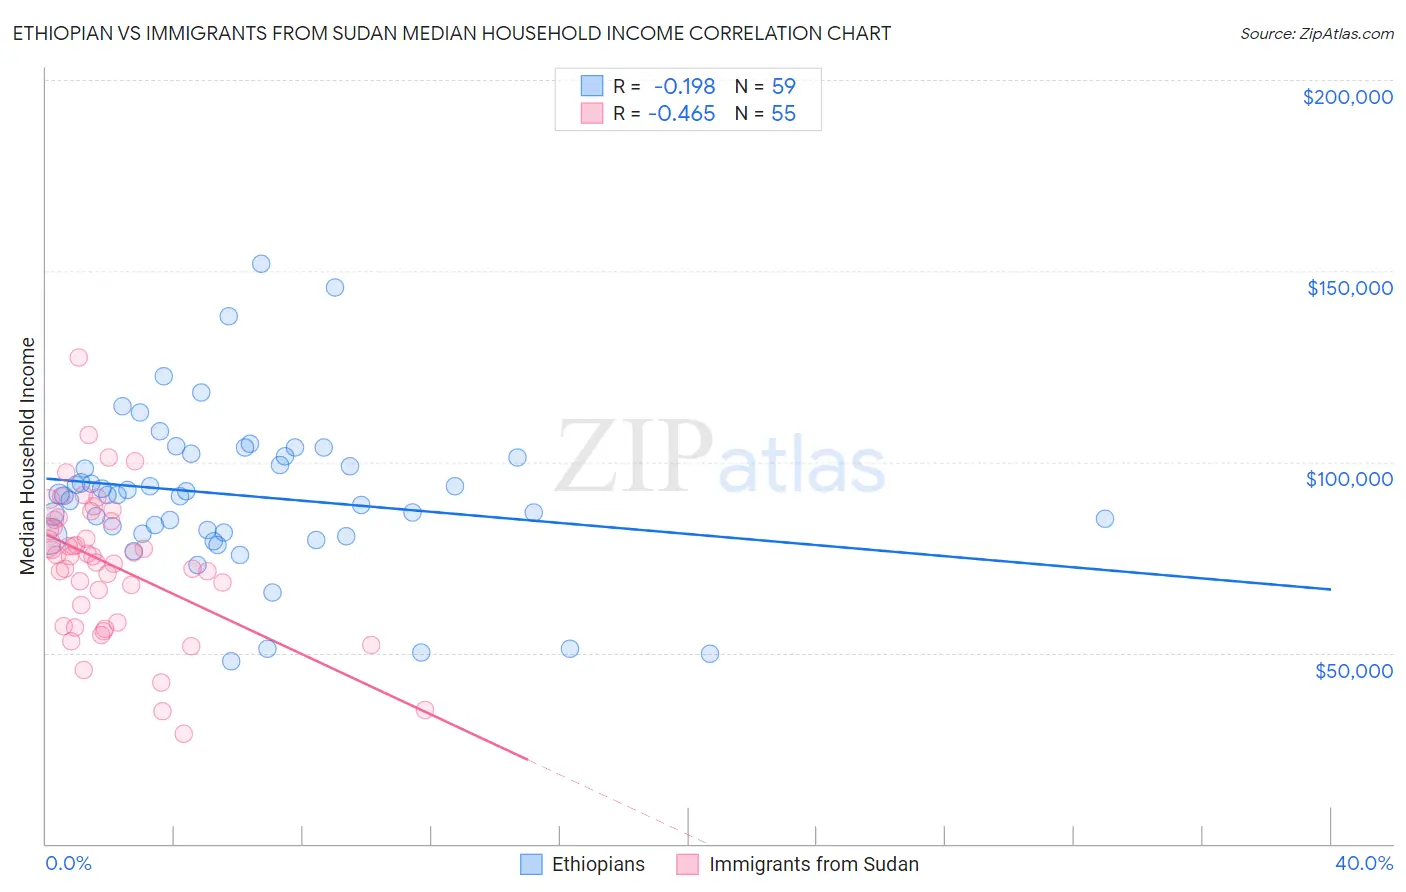
Ethiopian vs Immigrants from Sudan Median Household Income Correlation Chart
The statistical analysis conducted on geographies consisting of 223,045,474 people shows a poor negative correlation between the proportion of Ethiopians and median household income in the United States with a correlation coefficient (R) of -0.198 and weighted average of $89,640. Similarly, the statistical analysis conducted on geographies consisting of 118,931,999 people shows a moderate negative correlation between the proportion of Immigrants from Sudan and median household income in the United States with a correlation coefficient (R) of -0.465 and weighted average of $79,103, a difference of 13.3%.
Median Household Income Correlation Summary
| Measurement | Ethiopian | Immigrants from Sudan |
| Minimum | $47,668 | $28,750 |
| Maximum | $151,943 | $127,214 |
| Range | $104,275 | $98,464 |
| Mean | $91,215 | $73,170 |
| Median | $91,248 | $75,325 |
| Interquartile 25% (IQ1) | $81,124 | $58,025 |
| Interquartile 75% (IQ3) | $101,374 | $84,793 |
| Interquartile Range (IQR) | $20,250 | $26,769 |
| Standard Deviation (Sample) | $20,515 | $18,620 |
| Standard Deviation (Population) | $20,340 | $18,450 |
Similar Demographics by Median Household Income
Demographics Similar to Ethiopians by Median Household Income
In terms of median household income, the demographic groups most similar to Ethiopians are Pakistani ($89,638, a difference of 0.0%), Immigrants from North Macedonia ($89,741, a difference of 0.11%), Albanian ($89,744, a difference of 0.12%), Immigrants from Zimbabwe ($89,496, a difference of 0.16%), and Syrian ($89,830, a difference of 0.21%).
| Demographics | Rating | Rank | Median Household Income |
| Immigrants | Northern Africa | 95.9 /100 | #114 | Exceptional $90,026 |
| Immigrants | Western Asia | 95.9 /100 | #115 | Exceptional $90,005 |
| Native Hawaiians | 95.7 /100 | #116 | Exceptional $89,919 |
| Taiwanese | 95.6 /100 | #117 | Exceptional $89,900 |
| Syrians | 95.4 /100 | #118 | Exceptional $89,830 |
| Albanians | 95.2 /100 | #119 | Exceptional $89,744 |
| Immigrants | North Macedonia | 95.2 /100 | #120 | Exceptional $89,741 |
| Ethiopians | 94.9 /100 | #121 | Exceptional $89,640 |
| Pakistanis | 94.8 /100 | #122 | Exceptional $89,638 |
| Immigrants | Zimbabwe | 94.4 /100 | #123 | Exceptional $89,496 |
| Immigrants | Jordan | 94.1 /100 | #124 | Exceptional $89,412 |
| Immigrants | Kuwait | 93.5 /100 | #125 | Exceptional $89,263 |
| Immigrants | Oceania | 92.9 /100 | #126 | Exceptional $89,100 |
| Immigrants | Peru | 92.5 /100 | #127 | Exceptional $89,010 |
| Portuguese | 92.3 /100 | #128 | Exceptional $88,976 |
Demographics Similar to Immigrants from Sudan by Median Household Income
In terms of median household income, the demographic groups most similar to Immigrants from Sudan are Immigrants from Barbados ($78,989, a difference of 0.14%), Marshallese ($78,930, a difference of 0.22%), Inupiat ($78,841, a difference of 0.33%), Central American ($78,803, a difference of 0.38%), and Nonimmigrants ($79,429, a difference of 0.41%).
| Demographics | Rating | Rank | Median Household Income |
| Immigrants | Guyana | 4.5 /100 | #235 | Tragic $80,324 |
| Immigrants | Bosnia and Herzegovina | 3.4 /100 | #236 | Tragic $79,888 |
| Nicaraguans | 3.1 /100 | #237 | Tragic $79,737 |
| Barbadians | 3.0 /100 | #238 | Tragic $79,664 |
| Alaska Natives | 2.7 /100 | #239 | Tragic $79,509 |
| Immigrants | Western Africa | 2.7 /100 | #240 | Tragic $79,490 |
| Immigrants | Nonimmigrants | 2.6 /100 | #241 | Tragic $79,429 |
| Immigrants | Sudan | 2.1 /100 | #242 | Tragic $79,103 |
| Immigrants | Barbados | 1.9 /100 | #243 | Tragic $78,989 |
| Marshallese | 1.9 /100 | #244 | Tragic $78,930 |
| Inupiat | 1.8 /100 | #245 | Tragic $78,841 |
| Central Americans | 1.7 /100 | #246 | Tragic $78,803 |
| Immigrants | Burma/Myanmar | 1.6 /100 | #247 | Tragic $78,682 |
| Sudanese | 1.5 /100 | #248 | Tragic $78,529 |
| West Indians | 1.4 /100 | #249 | Tragic $78,455 |