Ethiopian vs Lebanese Median Household Income
COMPARE
Ethiopian
Lebanese
Median Household Income
Median Household Income Comparison
Ethiopians
Lebanese
$89,640
MEDIAN HOUSEHOLD INCOME
94.9/ 100
METRIC RATING
121st/ 347
METRIC RANK
$88,091
MEDIAN HOUSEHOLD INCOME
87.2/ 100
METRIC RATING
140th/ 347
METRIC RANK
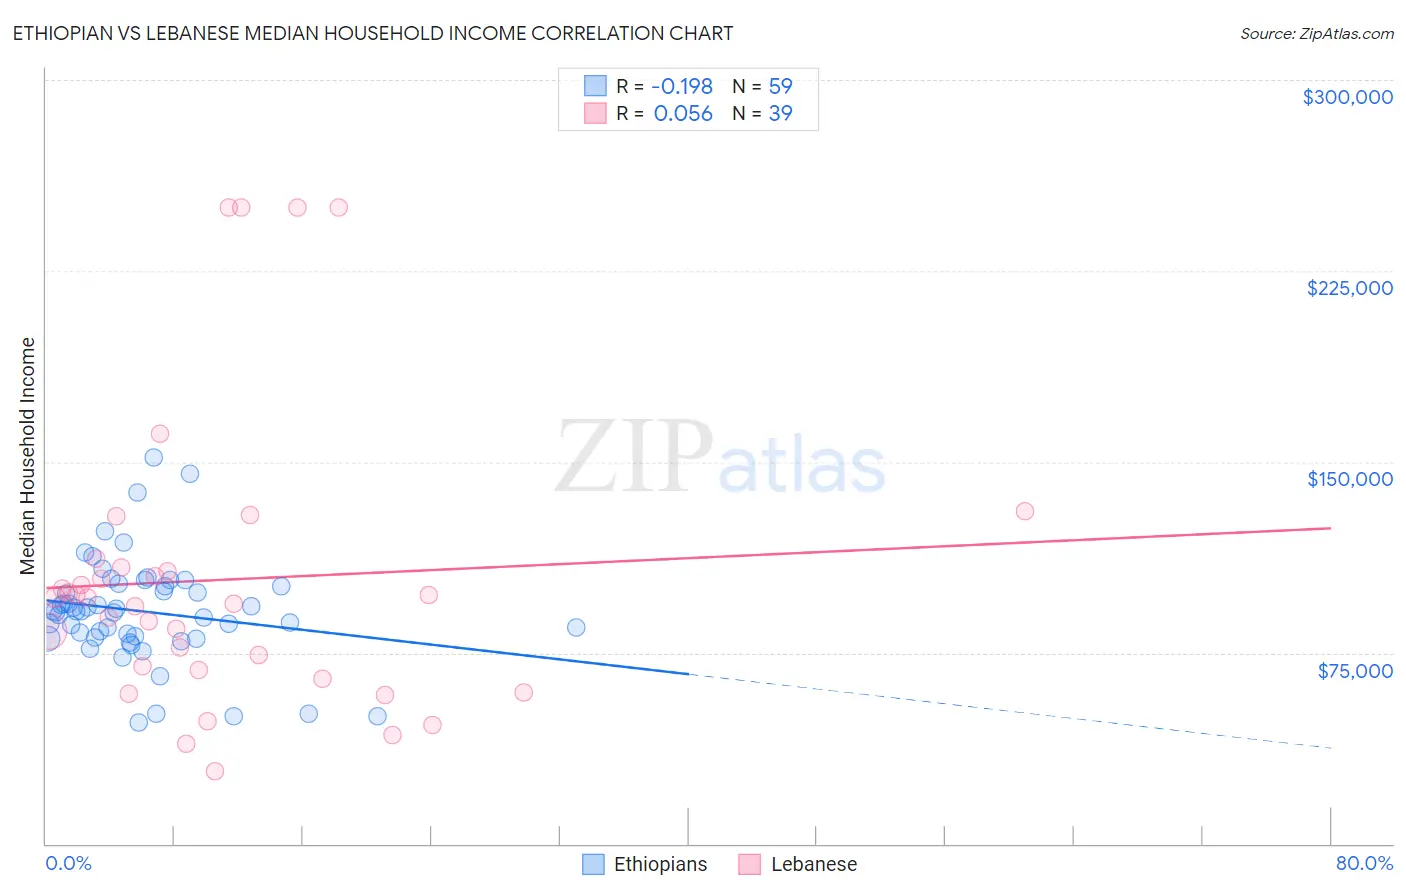
Ethiopian vs Lebanese Median Household Income Correlation Chart
The statistical analysis conducted on geographies consisting of 223,045,474 people shows a poor negative correlation between the proportion of Ethiopians and median household income in the United States with a correlation coefficient (R) of -0.198 and weighted average of $89,640. Similarly, the statistical analysis conducted on geographies consisting of 401,232,119 people shows a slight positive correlation between the proportion of Lebanese and median household income in the United States with a correlation coefficient (R) of 0.056 and weighted average of $88,091, a difference of 1.8%.
Median Household Income Correlation Summary
| Measurement | Ethiopian | Lebanese |
| Minimum | $47,668 | $28,348 |
| Maximum | $151,943 | $250,001 |
| Range | $104,275 | $221,653 |
| Mean | $91,215 | $103,665 |
| Median | $91,248 | $96,621 |
| Interquartile 25% (IQ1) | $81,124 | $68,125 |
| Interquartile 75% (IQ3) | $101,374 | $108,387 |
| Interquartile Range (IQR) | $20,250 | $40,262 |
| Standard Deviation (Sample) | $20,515 | $57,143 |
| Standard Deviation (Population) | $20,340 | $56,406 |
Demographics Similar to Ethiopians and Lebanese by Median Household Income
In terms of median household income, the demographic groups most similar to Ethiopians are Pakistani ($89,638, a difference of 0.0%), Immigrants from North Macedonia ($89,741, a difference of 0.11%), Immigrants from Zimbabwe ($89,496, a difference of 0.16%), Immigrants from Jordan ($89,412, a difference of 0.25%), and Immigrants from Kuwait ($89,263, a difference of 0.42%). Similarly, the demographic groups most similar to Lebanese are Immigrants from Chile ($88,388, a difference of 0.34%), Arab ($88,398, a difference of 0.35%), Sierra Leonean ($88,463, a difference of 0.42%), Polish ($88,472, a difference of 0.43%), and Immigrants from Sierra Leone ($88,498, a difference of 0.46%).
| Demographics | Rating | Rank | Median Household Income |
| Immigrants | North Macedonia | 95.2 /100 | #120 | Exceptional $89,741 |
| Ethiopians | 94.9 /100 | #121 | Exceptional $89,640 |
| Pakistanis | 94.8 /100 | #122 | Exceptional $89,638 |
| Immigrants | Zimbabwe | 94.4 /100 | #123 | Exceptional $89,496 |
| Immigrants | Jordan | 94.1 /100 | #124 | Exceptional $89,412 |
| Immigrants | Kuwait | 93.5 /100 | #125 | Exceptional $89,263 |
| Immigrants | Oceania | 92.9 /100 | #126 | Exceptional $89,100 |
| Immigrants | Peru | 92.5 /100 | #127 | Exceptional $89,010 |
| Portuguese | 92.3 /100 | #128 | Exceptional $88,976 |
| Brazilians | 92.1 /100 | #129 | Exceptional $88,934 |
| British | 92.0 /100 | #130 | Exceptional $88,914 |
| Immigrants | Syria | 91.4 /100 | #131 | Exceptional $88,792 |
| Europeans | 91.2 /100 | #132 | Exceptional $88,751 |
| Immigrants | Ethiopia | 90.9 /100 | #133 | Exceptional $88,687 |
| Swedes | 90.0 /100 | #134 | Exceptional $88,524 |
| Immigrants | Sierra Leone | 89.9 /100 | #135 | Excellent $88,498 |
| Poles | 89.7 /100 | #136 | Excellent $88,472 |
| Sierra Leoneans | 89.6 /100 | #137 | Excellent $88,463 |
| Arabs | 89.2 /100 | #138 | Excellent $88,398 |
| Immigrants | Chile | 89.2 /100 | #139 | Excellent $88,388 |
| Lebanese | 87.2 /100 | #140 | Excellent $88,091 |