Welsh vs Immigrants from Mexico Median Household Income
COMPARE
Welsh
Immigrants from Mexico
Median Household Income
Median Household Income Comparison
Welsh
Immigrants from Mexico
$83,628
MEDIAN HOUSEHOLD INCOME
28.0/ 100
METRIC RATING
192nd/ 347
METRIC RANK
$73,160
MEDIAN HOUSEHOLD INCOME
0.0/ 100
METRIC RATING
297th/ 347
METRIC RANK
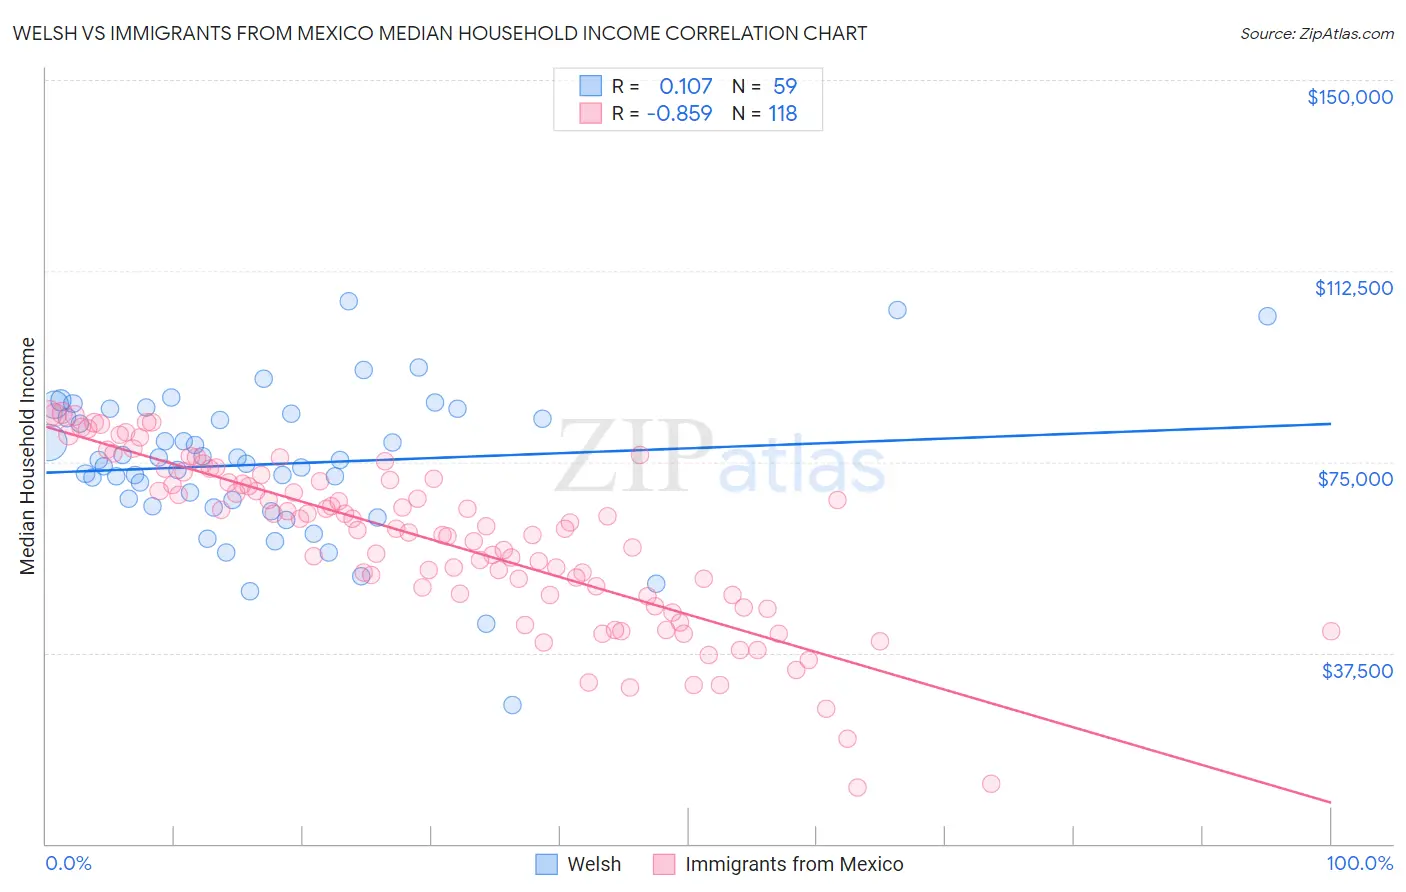
Welsh vs Immigrants from Mexico Median Household Income Correlation Chart
The statistical analysis conducted on geographies consisting of 527,928,431 people shows a poor positive correlation between the proportion of Welsh and median household income in the United States with a correlation coefficient (R) of 0.107 and weighted average of $83,628. Similarly, the statistical analysis conducted on geographies consisting of 513,131,801 people shows a very strong negative correlation between the proportion of Immigrants from Mexico and median household income in the United States with a correlation coefficient (R) of -0.859 and weighted average of $73,160, a difference of 14.3%.
Median Household Income Correlation Summary
| Measurement | Welsh | Immigrants from Mexico |
| Minimum | $27,188 | $11,125 |
| Maximum | $106,528 | $84,609 |
| Range | $79,340 | $73,484 |
| Mean | $74,552 | $59,423 |
| Median | $75,263 | $61,801 |
| Interquartile 25% (IQ1) | $66,384 | $48,735 |
| Interquartile 75% (IQ3) | $84,494 | $71,471 |
| Interquartile Range (IQR) | $18,110 | $22,736 |
| Standard Deviation (Sample) | $14,468 | $16,352 |
| Standard Deviation (Population) | $14,345 | $16,282 |
Similar Demographics by Median Household Income
Demographics Similar to Welsh by Median Household Income
In terms of median household income, the demographic groups most similar to Welsh are Finnish ($83,607, a difference of 0.030%), Ghanaian ($83,582, a difference of 0.060%), Immigrants from Armenia ($83,555, a difference of 0.090%), Iraqi ($83,753, a difference of 0.15%), and French ($83,468, a difference of 0.19%).
| Demographics | Rating | Rank | Median Household Income |
| Kenyans | 34.2 /100 | #185 | Fair $84,085 |
| Puget Sound Salish | 33.2 /100 | #186 | Fair $84,011 |
| Belgians | 33.2 /100 | #187 | Fair $84,008 |
| Tlingit-Haida | 32.6 /100 | #188 | Fair $83,968 |
| Immigrants | Colombia | 31.7 /100 | #189 | Fair $83,902 |
| Slovaks | 30.2 /100 | #190 | Fair $83,798 |
| Iraqis | 29.6 /100 | #191 | Fair $83,753 |
| Welsh | 28.0 /100 | #192 | Fair $83,628 |
| Finns | 27.7 /100 | #193 | Fair $83,607 |
| Ghanaians | 27.4 /100 | #194 | Fair $83,582 |
| Immigrants | Armenia | 27.0 /100 | #195 | Fair $83,555 |
| French | 26.0 /100 | #196 | Fair $83,468 |
| Aleuts | 25.7 /100 | #197 | Fair $83,446 |
| Japanese | 25.1 /100 | #198 | Fair $83,395 |
| Germans | 24.6 /100 | #199 | Fair $83,358 |
Demographics Similar to Immigrants from Mexico by Median Household Income
In terms of median household income, the demographic groups most similar to Immigrants from Mexico are Haitian ($73,306, a difference of 0.20%), Paiute ($72,959, a difference of 0.27%), Cuban ($73,392, a difference of 0.32%), Indonesian ($72,856, a difference of 0.42%), and Blackfeet ($73,509, a difference of 0.48%).
| Demographics | Rating | Rank | Median Household Income |
| Bangladeshis | 0.1 /100 | #290 | Tragic $74,112 |
| Hispanics or Latinos | 0.1 /100 | #291 | Tragic $73,823 |
| Comanche | 0.1 /100 | #292 | Tragic $73,747 |
| Immigrants | Cabo Verde | 0.1 /100 | #293 | Tragic $73,515 |
| Blackfeet | 0.1 /100 | #294 | Tragic $73,509 |
| Cubans | 0.1 /100 | #295 | Tragic $73,392 |
| Haitians | 0.1 /100 | #296 | Tragic $73,306 |
| Immigrants | Mexico | 0.0 /100 | #297 | Tragic $73,160 |
| Paiute | 0.0 /100 | #298 | Tragic $72,959 |
| Indonesians | 0.0 /100 | #299 | Tragic $72,856 |
| Immigrants | Dominica | 0.0 /100 | #300 | Tragic $72,760 |
| Cherokee | 0.0 /100 | #301 | Tragic $72,682 |
| Shoshone | 0.0 /100 | #302 | Tragic $72,660 |
| Africans | 0.0 /100 | #303 | Tragic $72,650 |
| Immigrants | Haiti | 0.0 /100 | #304 | Tragic $72,599 |