Seminole vs Immigrants from Mexico Median Household Income
COMPARE
Seminole
Immigrants from Mexico
Median Household Income
Median Household Income Comparison
Seminole
Immigrants from Mexico
$69,420
MEDIAN HOUSEHOLD INCOME
0.0/ 100
METRIC RATING
325th/ 347
METRIC RANK
$73,160
MEDIAN HOUSEHOLD INCOME
0.0/ 100
METRIC RATING
297th/ 347
METRIC RANK
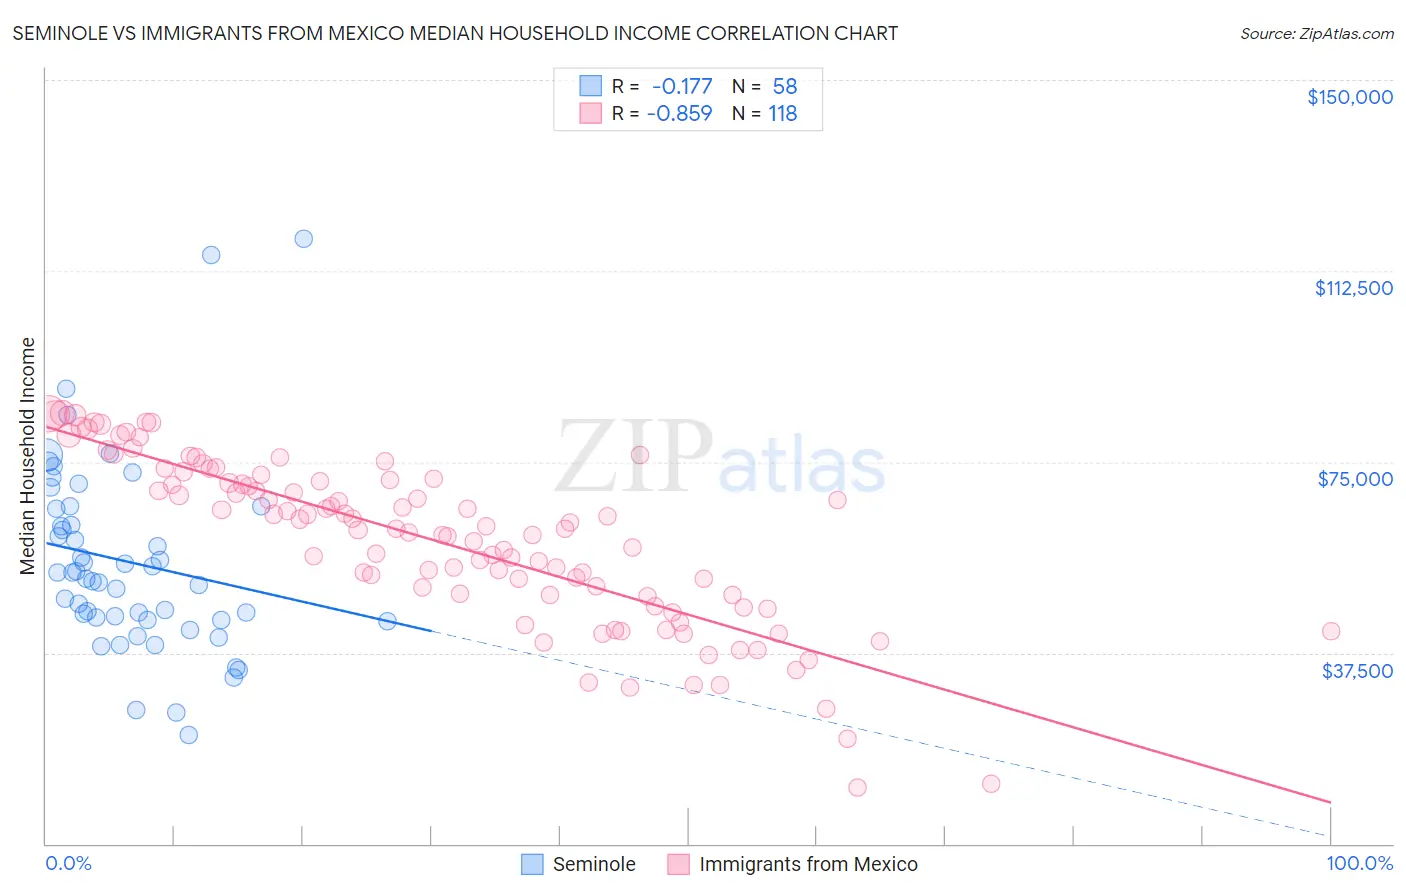
Seminole vs Immigrants from Mexico Median Household Income Correlation Chart
The statistical analysis conducted on geographies consisting of 118,297,671 people shows a poor negative correlation between the proportion of Seminole and median household income in the United States with a correlation coefficient (R) of -0.177 and weighted average of $69,420. Similarly, the statistical analysis conducted on geographies consisting of 513,131,801 people shows a very strong negative correlation between the proportion of Immigrants from Mexico and median household income in the United States with a correlation coefficient (R) of -0.859 and weighted average of $73,160, a difference of 5.4%.
Median Household Income Correlation Summary
| Measurement | Seminole | Immigrants from Mexico |
| Minimum | $21,429 | $11,125 |
| Maximum | $118,750 | $84,609 |
| Range | $97,321 | $73,484 |
| Mean | $55,357 | $59,423 |
| Median | $52,689 | $61,801 |
| Interquartile 25% (IQ1) | $44,050 | $48,735 |
| Interquartile 75% (IQ3) | $65,850 | $71,471 |
| Interquartile Range (IQR) | $21,800 | $22,736 |
| Standard Deviation (Sample) | $18,667 | $16,352 |
| Standard Deviation (Population) | $18,505 | $16,282 |
Similar Demographics by Median Household Income
Demographics Similar to Seminole by Median Household Income
In terms of median household income, the demographic groups most similar to Seminole are Yup'ik ($69,695, a difference of 0.40%), Bahamian ($69,726, a difference of 0.44%), Choctaw ($69,947, a difference of 0.76%), Chickasaw ($70,005, a difference of 0.84%), and Colville ($70,094, a difference of 0.97%).
| Demographics | Rating | Rank | Median Household Income |
| Chippewa | 0.0 /100 | #318 | Tragic $70,539 |
| Immigrants | Dominican Republic | 0.0 /100 | #319 | Tragic $70,208 |
| Colville | 0.0 /100 | #320 | Tragic $70,094 |
| Chickasaw | 0.0 /100 | #321 | Tragic $70,005 |
| Choctaw | 0.0 /100 | #322 | Tragic $69,947 |
| Bahamians | 0.0 /100 | #323 | Tragic $69,726 |
| Yup'ik | 0.0 /100 | #324 | Tragic $69,695 |
| Seminole | 0.0 /100 | #325 | Tragic $69,420 |
| Yuman | 0.0 /100 | #326 | Tragic $68,743 |
| Immigrants | Cuba | 0.0 /100 | #327 | Tragic $68,461 |
| Menominee | 0.0 /100 | #328 | Tragic $68,423 |
| Dutch West Indians | 0.0 /100 | #329 | Tragic $68,412 |
| Arapaho | 0.0 /100 | #330 | Tragic $67,965 |
| Natives/Alaskans | 0.0 /100 | #331 | Tragic $67,879 |
| Sioux | 0.0 /100 | #332 | Tragic $67,792 |
Demographics Similar to Immigrants from Mexico by Median Household Income
In terms of median household income, the demographic groups most similar to Immigrants from Mexico are Haitian ($73,306, a difference of 0.20%), Paiute ($72,959, a difference of 0.27%), Cuban ($73,392, a difference of 0.32%), Indonesian ($72,856, a difference of 0.42%), and Blackfeet ($73,509, a difference of 0.48%).
| Demographics | Rating | Rank | Median Household Income |
| Bangladeshis | 0.1 /100 | #290 | Tragic $74,112 |
| Hispanics or Latinos | 0.1 /100 | #291 | Tragic $73,823 |
| Comanche | 0.1 /100 | #292 | Tragic $73,747 |
| Immigrants | Cabo Verde | 0.1 /100 | #293 | Tragic $73,515 |
| Blackfeet | 0.1 /100 | #294 | Tragic $73,509 |
| Cubans | 0.1 /100 | #295 | Tragic $73,392 |
| Haitians | 0.1 /100 | #296 | Tragic $73,306 |
| Immigrants | Mexico | 0.0 /100 | #297 | Tragic $73,160 |
| Paiute | 0.0 /100 | #298 | Tragic $72,959 |
| Indonesians | 0.0 /100 | #299 | Tragic $72,856 |
| Immigrants | Dominica | 0.0 /100 | #300 | Tragic $72,760 |
| Cherokee | 0.0 /100 | #301 | Tragic $72,682 |
| Shoshone | 0.0 /100 | #302 | Tragic $72,660 |
| Africans | 0.0 /100 | #303 | Tragic $72,650 |
| Immigrants | Haiti | 0.0 /100 | #304 | Tragic $72,599 |