Ethiopian vs Immigrants from Iraq Median Household Income
COMPARE
Ethiopian
Immigrants from Iraq
Median Household Income
Median Household Income Comparison
Ethiopians
Immigrants from Iraq
$89,640
MEDIAN HOUSEHOLD INCOME
94.9/ 100
METRIC RATING
121st/ 347
METRIC RANK
$82,594
MEDIAN HOUSEHOLD INCOME
16.7/ 100
METRIC RATING
209th/ 347
METRIC RANK
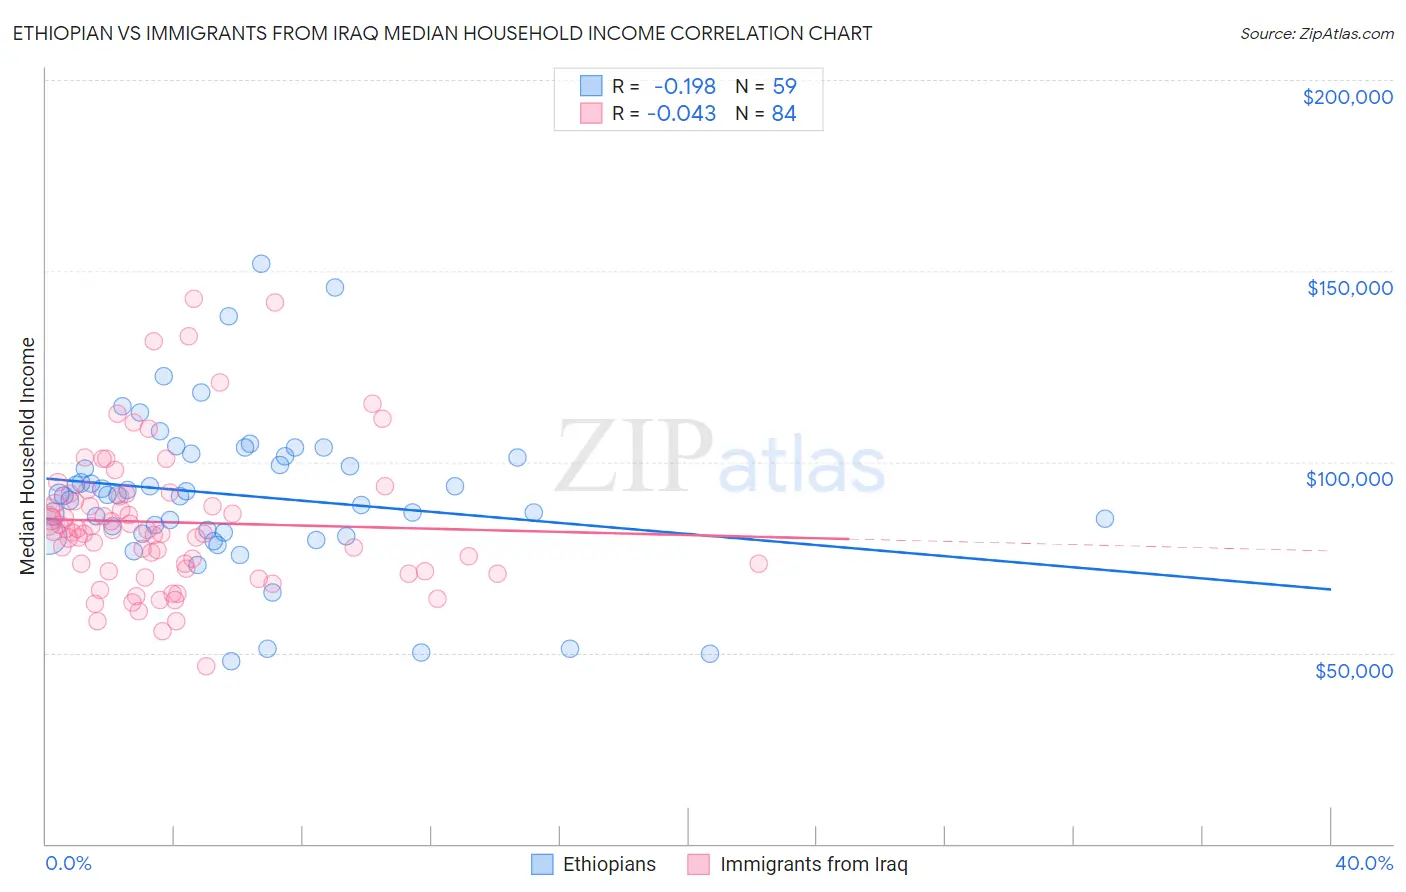
Ethiopian vs Immigrants from Iraq Median Household Income Correlation Chart
The statistical analysis conducted on geographies consisting of 223,045,474 people shows a poor negative correlation between the proportion of Ethiopians and median household income in the United States with a correlation coefficient (R) of -0.198 and weighted average of $89,640. Similarly, the statistical analysis conducted on geographies consisting of 194,736,423 people shows no correlation between the proportion of Immigrants from Iraq and median household income in the United States with a correlation coefficient (R) of -0.043 and weighted average of $82,594, a difference of 8.5%.
Median Household Income Correlation Summary
| Measurement | Ethiopian | Immigrants from Iraq |
| Minimum | $47,668 | $46,565 |
| Maximum | $151,943 | $142,768 |
| Range | $104,275 | $96,203 |
| Mean | $91,215 | $84,180 |
| Median | $91,248 | $81,932 |
| Interquartile 25% (IQ1) | $81,124 | $71,691 |
| Interquartile 75% (IQ3) | $101,374 | $91,376 |
| Interquartile Range (IQR) | $20,250 | $19,685 |
| Standard Deviation (Sample) | $20,515 | $18,542 |
| Standard Deviation (Population) | $20,340 | $18,431 |
Similar Demographics by Median Household Income
Demographics Similar to Ethiopians by Median Household Income
In terms of median household income, the demographic groups most similar to Ethiopians are Pakistani ($89,638, a difference of 0.0%), Immigrants from North Macedonia ($89,741, a difference of 0.11%), Albanian ($89,744, a difference of 0.12%), Immigrants from Zimbabwe ($89,496, a difference of 0.16%), and Syrian ($89,830, a difference of 0.21%).
| Demographics | Rating | Rank | Median Household Income |
| Immigrants | Northern Africa | 95.9 /100 | #114 | Exceptional $90,026 |
| Immigrants | Western Asia | 95.9 /100 | #115 | Exceptional $90,005 |
| Native Hawaiians | 95.7 /100 | #116 | Exceptional $89,919 |
| Taiwanese | 95.6 /100 | #117 | Exceptional $89,900 |
| Syrians | 95.4 /100 | #118 | Exceptional $89,830 |
| Albanians | 95.2 /100 | #119 | Exceptional $89,744 |
| Immigrants | North Macedonia | 95.2 /100 | #120 | Exceptional $89,741 |
| Ethiopians | 94.9 /100 | #121 | Exceptional $89,640 |
| Pakistanis | 94.8 /100 | #122 | Exceptional $89,638 |
| Immigrants | Zimbabwe | 94.4 /100 | #123 | Exceptional $89,496 |
| Immigrants | Jordan | 94.1 /100 | #124 | Exceptional $89,412 |
| Immigrants | Kuwait | 93.5 /100 | #125 | Exceptional $89,263 |
| Immigrants | Oceania | 92.9 /100 | #126 | Exceptional $89,100 |
| Immigrants | Peru | 92.5 /100 | #127 | Exceptional $89,010 |
| Portuguese | 92.3 /100 | #128 | Exceptional $88,976 |
Demographics Similar to Immigrants from Iraq by Median Household Income
In terms of median household income, the demographic groups most similar to Immigrants from Iraq are Immigrants from Uruguay ($82,560, a difference of 0.040%), Salvadoran ($82,449, a difference of 0.18%), Venezuelan ($82,432, a difference of 0.20%), Nepalese ($82,410, a difference of 0.22%), and French Canadian ($82,810, a difference of 0.26%).
| Demographics | Rating | Rank | Median Household Income |
| Immigrants | Thailand | 24.3 /100 | #202 | Fair $83,327 |
| Immigrants | Cambodia | 24.0 /100 | #203 | Fair $83,304 |
| Immigrants | Africa | 23.8 /100 | #204 | Fair $83,289 |
| Celtics | 22.7 /100 | #205 | Fair $83,193 |
| Immigrants | Kenya | 21.3 /100 | #206 | Fair $83,068 |
| Dutch | 20.3 /100 | #207 | Fair $82,971 |
| French Canadians | 18.7 /100 | #208 | Poor $82,810 |
| Immigrants | Iraq | 16.7 /100 | #209 | Poor $82,594 |
| Immigrants | Uruguay | 16.4 /100 | #210 | Poor $82,560 |
| Salvadorans | 15.4 /100 | #211 | Poor $82,449 |
| Venezuelans | 15.3 /100 | #212 | Poor $82,432 |
| Nepalese | 15.1 /100 | #213 | Poor $82,410 |
| Panamanians | 14.0 /100 | #214 | Poor $82,272 |
| Vietnamese | 13.8 /100 | #215 | Poor $82,248 |
| Yugoslavians | 13.3 /100 | #216 | Poor $82,186 |