Ethiopian vs Cypriot Median Household Income
COMPARE
Ethiopian
Cypriot
Median Household Income
Median Household Income Comparison
Ethiopians
Cypriots
$89,640
MEDIAN HOUSEHOLD INCOME
94.9/ 100
METRIC RATING
121st/ 347
METRIC RANK
$102,843
MEDIAN HOUSEHOLD INCOME
100.0/ 100
METRIC RATING
18th/ 347
METRIC RANK
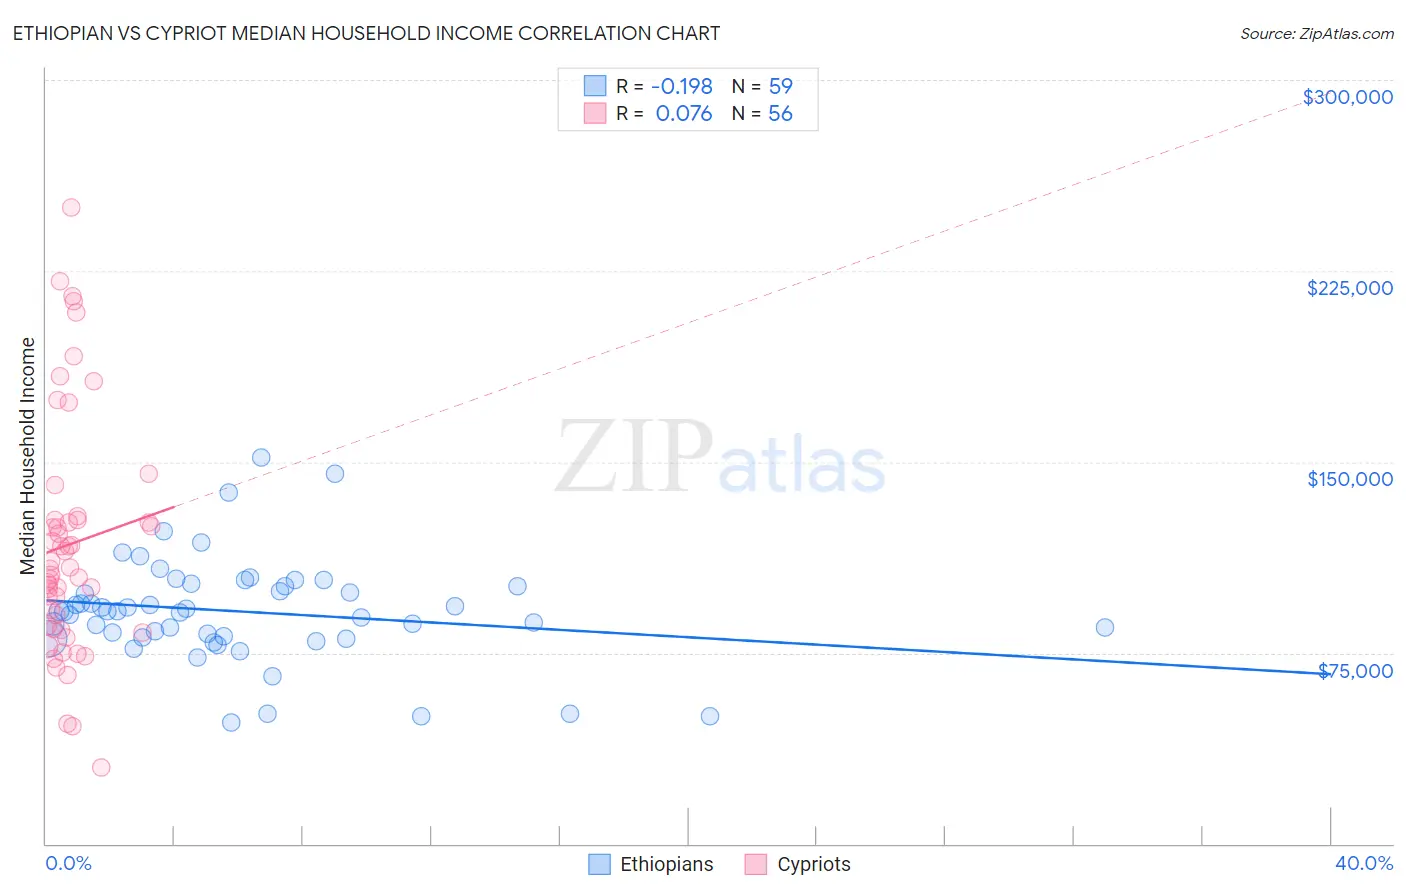
Ethiopian vs Cypriot Median Household Income Correlation Chart
The statistical analysis conducted on geographies consisting of 223,045,474 people shows a poor negative correlation between the proportion of Ethiopians and median household income in the United States with a correlation coefficient (R) of -0.198 and weighted average of $89,640. Similarly, the statistical analysis conducted on geographies consisting of 61,845,026 people shows a slight positive correlation between the proportion of Cypriots and median household income in the United States with a correlation coefficient (R) of 0.076 and weighted average of $102,843, a difference of 14.7%.
Median Household Income Correlation Summary
| Measurement | Ethiopian | Cypriot |
| Minimum | $47,668 | $30,029 |
| Maximum | $151,943 | $250,001 |
| Range | $104,275 | $219,972 |
| Mean | $91,215 | $117,612 |
| Median | $91,248 | $108,270 |
| Interquartile 25% (IQ1) | $81,124 | $84,969 |
| Interquartile 75% (IQ3) | $101,374 | $127,095 |
| Interquartile Range (IQR) | $20,250 | $42,126 |
| Standard Deviation (Sample) | $20,515 | $46,602 |
| Standard Deviation (Population) | $20,340 | $46,184 |
Similar Demographics by Median Household Income
Demographics Similar to Ethiopians by Median Household Income
In terms of median household income, the demographic groups most similar to Ethiopians are Pakistani ($89,638, a difference of 0.0%), Immigrants from North Macedonia ($89,741, a difference of 0.11%), Albanian ($89,744, a difference of 0.12%), Immigrants from Zimbabwe ($89,496, a difference of 0.16%), and Syrian ($89,830, a difference of 0.21%).
| Demographics | Rating | Rank | Median Household Income |
| Immigrants | Northern Africa | 95.9 /100 | #114 | Exceptional $90,026 |
| Immigrants | Western Asia | 95.9 /100 | #115 | Exceptional $90,005 |
| Native Hawaiians | 95.7 /100 | #116 | Exceptional $89,919 |
| Taiwanese | 95.6 /100 | #117 | Exceptional $89,900 |
| Syrians | 95.4 /100 | #118 | Exceptional $89,830 |
| Albanians | 95.2 /100 | #119 | Exceptional $89,744 |
| Immigrants | North Macedonia | 95.2 /100 | #120 | Exceptional $89,741 |
| Ethiopians | 94.9 /100 | #121 | Exceptional $89,640 |
| Pakistanis | 94.8 /100 | #122 | Exceptional $89,638 |
| Immigrants | Zimbabwe | 94.4 /100 | #123 | Exceptional $89,496 |
| Immigrants | Jordan | 94.1 /100 | #124 | Exceptional $89,412 |
| Immigrants | Kuwait | 93.5 /100 | #125 | Exceptional $89,263 |
| Immigrants | Oceania | 92.9 /100 | #126 | Exceptional $89,100 |
| Immigrants | Peru | 92.5 /100 | #127 | Exceptional $89,010 |
| Portuguese | 92.3 /100 | #128 | Exceptional $88,976 |
Demographics Similar to Cypriots by Median Household Income
In terms of median household income, the demographic groups most similar to Cypriots are Immigrants from Korea ($102,962, a difference of 0.12%), Immigrants from Australia ($102,562, a difference of 0.27%), Burmese ($103,145, a difference of 0.29%), Bolivian ($102,195, a difference of 0.63%), and Eastern European ($101,781, a difference of 1.0%).
| Demographics | Rating | Rank | Median Household Income |
| Immigrants | China | 100.0 /100 | #11 | Exceptional $105,335 |
| Indians (Asian) | 100.0 /100 | #12 | Exceptional $105,262 |
| Immigrants | Eastern Asia | 100.0 /100 | #13 | Exceptional $104,796 |
| Immigrants | Ireland | 100.0 /100 | #14 | Exceptional $104,692 |
| Immigrants | Israel | 100.0 /100 | #15 | Exceptional $104,090 |
| Burmese | 100.0 /100 | #16 | Exceptional $103,145 |
| Immigrants | Korea | 100.0 /100 | #17 | Exceptional $102,962 |
| Cypriots | 100.0 /100 | #18 | Exceptional $102,843 |
| Immigrants | Australia | 100.0 /100 | #19 | Exceptional $102,562 |
| Bolivians | 100.0 /100 | #20 | Exceptional $102,195 |
| Eastern Europeans | 100.0 /100 | #21 | Exceptional $101,781 |
| Asians | 100.0 /100 | #22 | Exceptional $101,681 |
| Immigrants | Bolivia | 100.0 /100 | #23 | Exceptional $101,394 |
| Immigrants | Japan | 100.0 /100 | #24 | Exceptional $100,711 |
| Immigrants | Sweden | 100.0 /100 | #25 | Exceptional $100,699 |