Immigrants from Dominica vs Immigrants from Mexico Median Household Income
COMPARE
Immigrants from Dominica
Immigrants from Mexico
Median Household Income
Median Household Income Comparison
Immigrants from Dominica
Immigrants from Mexico
$72,760
MEDIAN HOUSEHOLD INCOME
0.0/ 100
METRIC RATING
300th/ 347
METRIC RANK
$73,160
MEDIAN HOUSEHOLD INCOME
0.0/ 100
METRIC RATING
297th/ 347
METRIC RANK
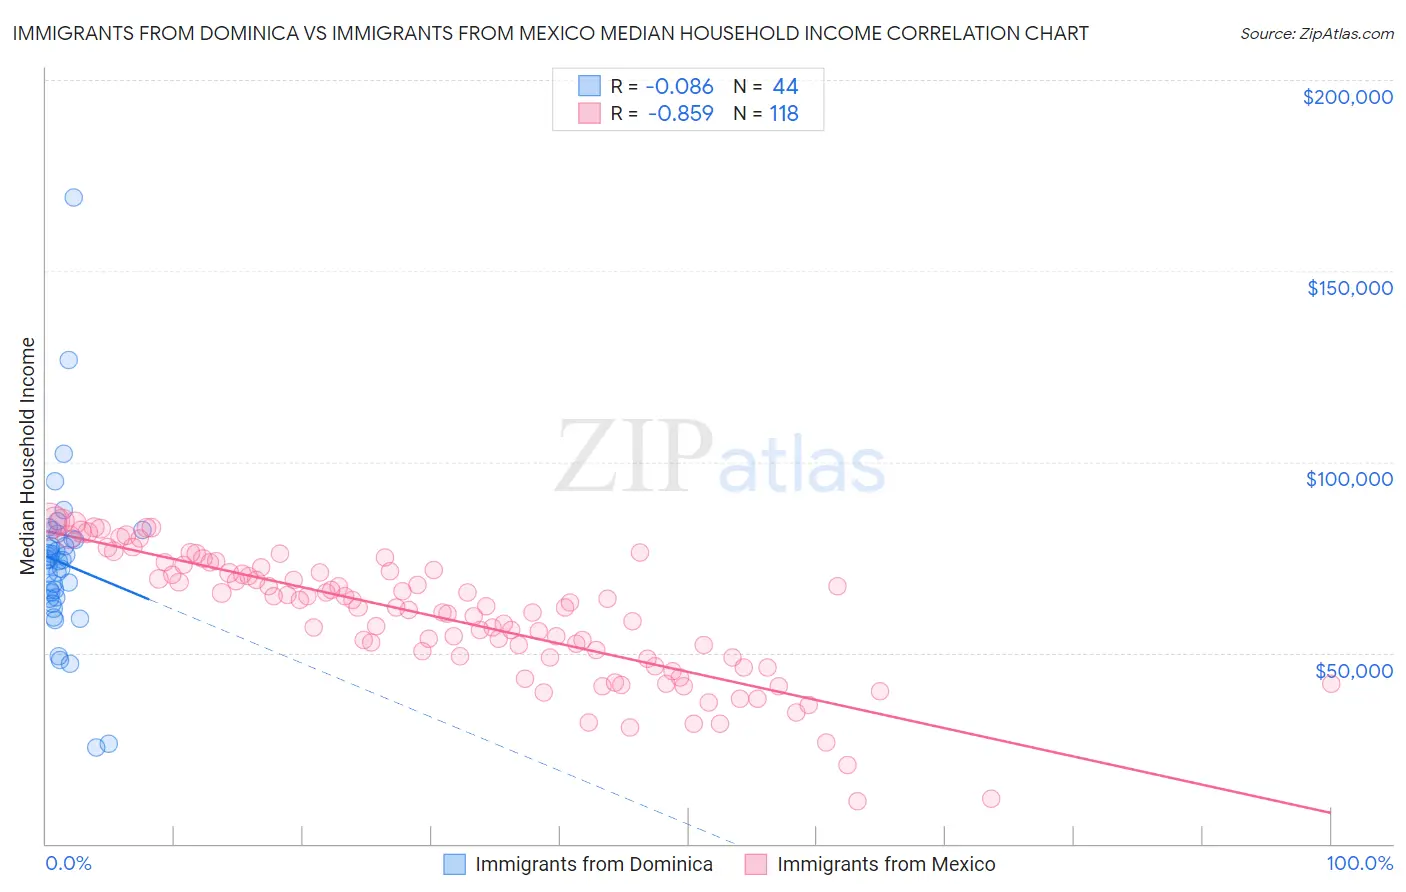
Immigrants from Dominica vs Immigrants from Mexico Median Household Income Correlation Chart
The statistical analysis conducted on geographies consisting of 83,788,429 people shows a slight negative correlation between the proportion of Immigrants from Dominica and median household income in the United States with a correlation coefficient (R) of -0.086 and weighted average of $72,760. Similarly, the statistical analysis conducted on geographies consisting of 513,131,801 people shows a very strong negative correlation between the proportion of Immigrants from Mexico and median household income in the United States with a correlation coefficient (R) of -0.859 and weighted average of $73,160, a difference of 0.55%.
Median Household Income Correlation Summary
| Measurement | Immigrants from Dominica | Immigrants from Mexico |
| Minimum | $25,050 | $11,125 |
| Maximum | $169,141 | $84,609 |
| Range | $144,091 | $73,484 |
| Mean | $73,512 | $59,423 |
| Median | $74,253 | $61,801 |
| Interquartile 25% (IQ1) | $64,327 | $48,735 |
| Interquartile 75% (IQ3) | $79,686 | $71,471 |
| Interquartile Range (IQR) | $15,359 | $22,736 |
| Standard Deviation (Sample) | $22,542 | $16,352 |
| Standard Deviation (Population) | $22,284 | $16,282 |
Demographics Similar to Immigrants from Dominica and Immigrants from Mexico by Median Household Income
In terms of median household income, the demographic groups most similar to Immigrants from Dominica are Cherokee ($72,682, a difference of 0.11%), Indonesian ($72,856, a difference of 0.13%), Shoshone ($72,660, a difference of 0.14%), African ($72,650, a difference of 0.15%), and Immigrants from Haiti ($72,599, a difference of 0.22%). Similarly, the demographic groups most similar to Immigrants from Mexico are Haitian ($73,306, a difference of 0.20%), Paiute ($72,959, a difference of 0.27%), Cuban ($73,392, a difference of 0.32%), Indonesian ($72,856, a difference of 0.42%), and Blackfeet ($73,509, a difference of 0.48%).
| Demographics | Rating | Rank | Median Household Income |
| Immigrants | Central America | 0.1 /100 | #288 | Tragic $74,217 |
| Fijians | 0.1 /100 | #289 | Tragic $74,205 |
| Bangladeshis | 0.1 /100 | #290 | Tragic $74,112 |
| Hispanics or Latinos | 0.1 /100 | #291 | Tragic $73,823 |
| Comanche | 0.1 /100 | #292 | Tragic $73,747 |
| Immigrants | Cabo Verde | 0.1 /100 | #293 | Tragic $73,515 |
| Blackfeet | 0.1 /100 | #294 | Tragic $73,509 |
| Cubans | 0.1 /100 | #295 | Tragic $73,392 |
| Haitians | 0.1 /100 | #296 | Tragic $73,306 |
| Immigrants | Mexico | 0.0 /100 | #297 | Tragic $73,160 |
| Paiute | 0.0 /100 | #298 | Tragic $72,959 |
| Indonesians | 0.0 /100 | #299 | Tragic $72,856 |
| Immigrants | Dominica | 0.0 /100 | #300 | Tragic $72,760 |
| Cherokee | 0.0 /100 | #301 | Tragic $72,682 |
| Shoshone | 0.0 /100 | #302 | Tragic $72,660 |
| Africans | 0.0 /100 | #303 | Tragic $72,650 |
| Immigrants | Haiti | 0.0 /100 | #304 | Tragic $72,599 |
| Hondurans | 0.0 /100 | #305 | Tragic $72,588 |
| Potawatomi | 0.0 /100 | #306 | Tragic $72,576 |
| Ute | 0.0 /100 | #307 | Tragic $72,402 |
| Yakama | 0.0 /100 | #308 | Tragic $72,225 |