Immigrants from Uruguay vs Immigrants from Mexico Median Household Income
COMPARE
Immigrants from Uruguay
Immigrants from Mexico
Median Household Income
Median Household Income Comparison
Immigrants from Uruguay
Immigrants from Mexico
$82,560
MEDIAN HOUSEHOLD INCOME
16.4/ 100
METRIC RATING
210th/ 347
METRIC RANK
$73,160
MEDIAN HOUSEHOLD INCOME
0.0/ 100
METRIC RATING
297th/ 347
METRIC RANK
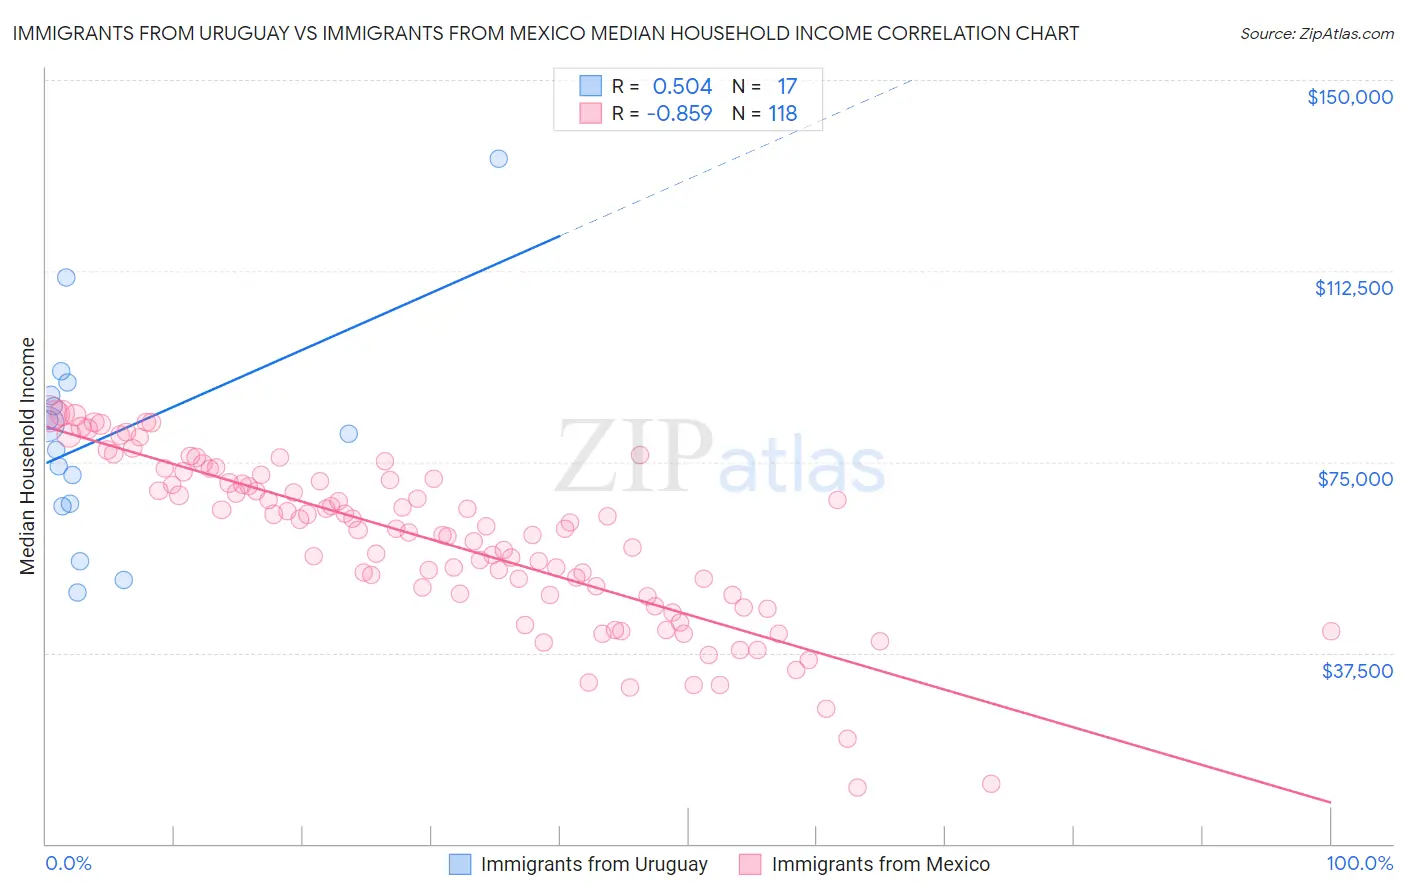
Immigrants from Uruguay vs Immigrants from Mexico Median Household Income Correlation Chart
The statistical analysis conducted on geographies consisting of 133,237,976 people shows a substantial positive correlation between the proportion of Immigrants from Uruguay and median household income in the United States with a correlation coefficient (R) of 0.504 and weighted average of $82,560. Similarly, the statistical analysis conducted on geographies consisting of 513,131,801 people shows a very strong negative correlation between the proportion of Immigrants from Mexico and median household income in the United States with a correlation coefficient (R) of -0.859 and weighted average of $73,160, a difference of 12.9%.
Median Household Income Correlation Summary
| Measurement | Immigrants from Uruguay | Immigrants from Mexico |
| Minimum | $49,241 | $11,125 |
| Maximum | $134,635 | $84,609 |
| Range | $85,394 | $73,484 |
| Mean | $80,181 | $59,423 |
| Median | $80,417 | $61,801 |
| Interquartile 25% (IQ1) | $66,523 | $48,735 |
| Interquartile 75% (IQ3) | $89,275 | $71,471 |
| Interquartile Range (IQR) | $22,752 | $22,736 |
| Standard Deviation (Sample) | $21,157 | $16,352 |
| Standard Deviation (Population) | $20,525 | $16,282 |
Similar Demographics by Median Household Income
Demographics Similar to Immigrants from Uruguay by Median Household Income
In terms of median household income, the demographic groups most similar to Immigrants from Uruguay are Immigrants from Iraq ($82,594, a difference of 0.040%), Salvadoran ($82,449, a difference of 0.14%), Venezuelan ($82,432, a difference of 0.16%), Nepalese ($82,410, a difference of 0.18%), and French Canadian ($82,810, a difference of 0.30%).
| Demographics | Rating | Rank | Median Household Income |
| Immigrants | Cambodia | 24.0 /100 | #203 | Fair $83,304 |
| Immigrants | Africa | 23.8 /100 | #204 | Fair $83,289 |
| Celtics | 22.7 /100 | #205 | Fair $83,193 |
| Immigrants | Kenya | 21.3 /100 | #206 | Fair $83,068 |
| Dutch | 20.3 /100 | #207 | Fair $82,971 |
| French Canadians | 18.7 /100 | #208 | Poor $82,810 |
| Immigrants | Iraq | 16.7 /100 | #209 | Poor $82,594 |
| Immigrants | Uruguay | 16.4 /100 | #210 | Poor $82,560 |
| Salvadorans | 15.4 /100 | #211 | Poor $82,449 |
| Venezuelans | 15.3 /100 | #212 | Poor $82,432 |
| Nepalese | 15.1 /100 | #213 | Poor $82,410 |
| Panamanians | 14.0 /100 | #214 | Poor $82,272 |
| Vietnamese | 13.8 /100 | #215 | Poor $82,248 |
| Yugoslavians | 13.3 /100 | #216 | Poor $82,186 |
| Ecuadorians | 12.5 /100 | #217 | Poor $82,070 |
Demographics Similar to Immigrants from Mexico by Median Household Income
In terms of median household income, the demographic groups most similar to Immigrants from Mexico are Haitian ($73,306, a difference of 0.20%), Paiute ($72,959, a difference of 0.27%), Cuban ($73,392, a difference of 0.32%), Indonesian ($72,856, a difference of 0.42%), and Blackfeet ($73,509, a difference of 0.48%).
| Demographics | Rating | Rank | Median Household Income |
| Bangladeshis | 0.1 /100 | #290 | Tragic $74,112 |
| Hispanics or Latinos | 0.1 /100 | #291 | Tragic $73,823 |
| Comanche | 0.1 /100 | #292 | Tragic $73,747 |
| Immigrants | Cabo Verde | 0.1 /100 | #293 | Tragic $73,515 |
| Blackfeet | 0.1 /100 | #294 | Tragic $73,509 |
| Cubans | 0.1 /100 | #295 | Tragic $73,392 |
| Haitians | 0.1 /100 | #296 | Tragic $73,306 |
| Immigrants | Mexico | 0.0 /100 | #297 | Tragic $73,160 |
| Paiute | 0.0 /100 | #298 | Tragic $72,959 |
| Indonesians | 0.0 /100 | #299 | Tragic $72,856 |
| Immigrants | Dominica | 0.0 /100 | #300 | Tragic $72,760 |
| Cherokee | 0.0 /100 | #301 | Tragic $72,682 |
| Shoshone | 0.0 /100 | #302 | Tragic $72,660 |
| Africans | 0.0 /100 | #303 | Tragic $72,650 |
| Immigrants | Haiti | 0.0 /100 | #304 | Tragic $72,599 |