Ethiopian vs American Median Household Income
COMPARE
Ethiopian
American
Median Household Income
Median Household Income Comparison
Ethiopians
Americans
$89,640
MEDIAN HOUSEHOLD INCOME
94.9/ 100
METRIC RATING
121st/ 347
METRIC RANK
$75,932
MEDIAN HOUSEHOLD INCOME
0.3/ 100
METRIC RATING
266th/ 347
METRIC RANK
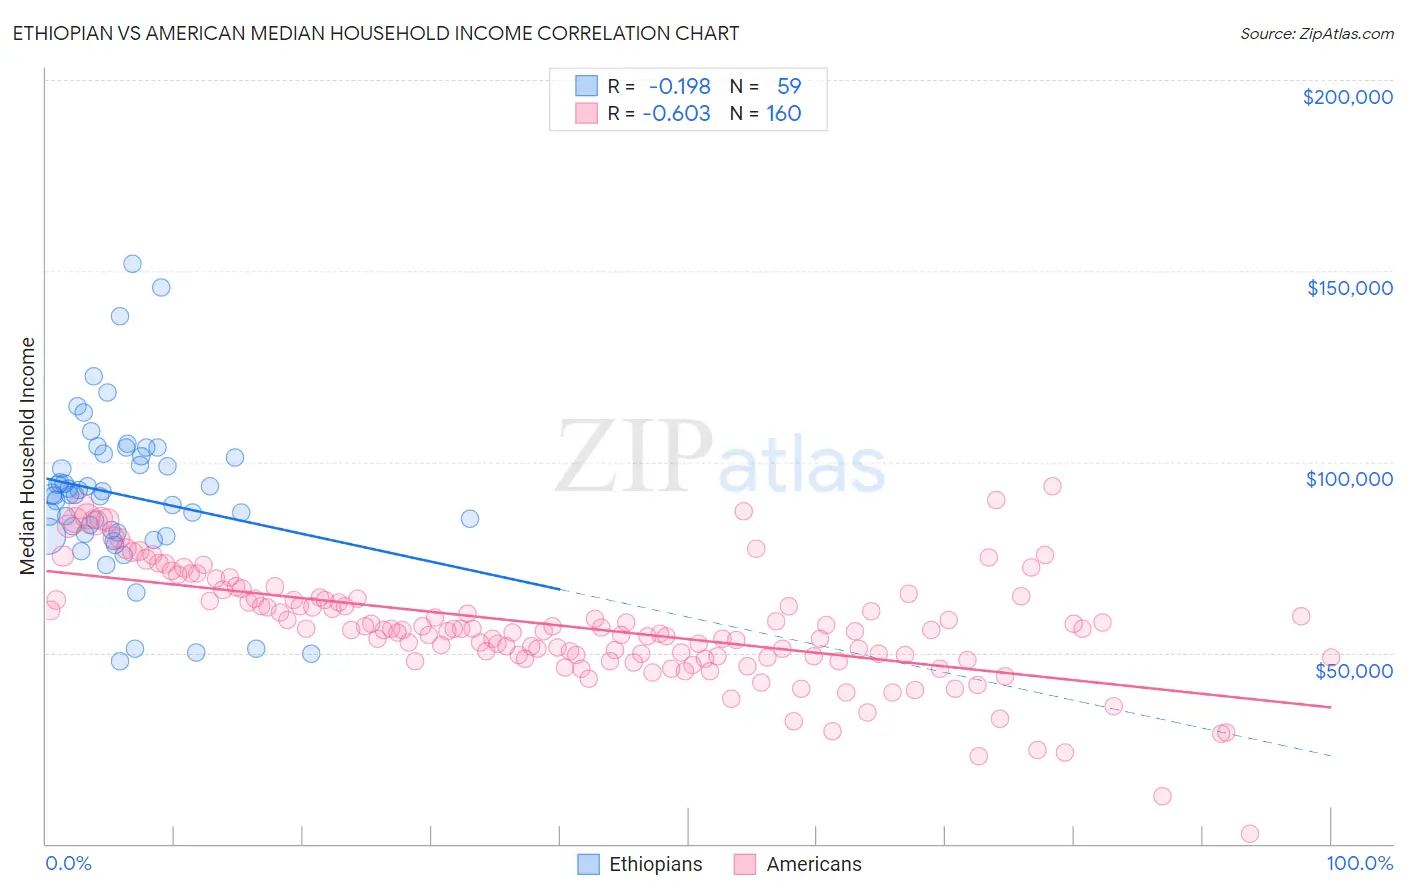
Ethiopian vs American Median Household Income Correlation Chart
The statistical analysis conducted on geographies consisting of 223,045,474 people shows a poor negative correlation between the proportion of Ethiopians and median household income in the United States with a correlation coefficient (R) of -0.198 and weighted average of $89,640. Similarly, the statistical analysis conducted on geographies consisting of 580,584,472 people shows a significant negative correlation between the proportion of Americans and median household income in the United States with a correlation coefficient (R) of -0.603 and weighted average of $75,932, a difference of 18.0%.
Median Household Income Correlation Summary
| Measurement | Ethiopian | American |
| Minimum | $47,668 | $2,499 |
| Maximum | $151,943 | $93,750 |
| Range | $104,275 | $91,251 |
| Mean | $91,215 | $56,747 |
| Median | $91,248 | $56,097 |
| Interquartile 25% (IQ1) | $81,124 | $48,888 |
| Interquartile 75% (IQ3) | $101,374 | $64,069 |
| Interquartile Range (IQR) | $20,250 | $15,181 |
| Standard Deviation (Sample) | $20,515 | $14,812 |
| Standard Deviation (Population) | $20,340 | $14,765 |
Similar Demographics by Median Household Income
Demographics Similar to Ethiopians by Median Household Income
In terms of median household income, the demographic groups most similar to Ethiopians are Pakistani ($89,638, a difference of 0.0%), Immigrants from North Macedonia ($89,741, a difference of 0.11%), Albanian ($89,744, a difference of 0.12%), Immigrants from Zimbabwe ($89,496, a difference of 0.16%), and Syrian ($89,830, a difference of 0.21%).
| Demographics | Rating | Rank | Median Household Income |
| Immigrants | Northern Africa | 95.9 /100 | #114 | Exceptional $90,026 |
| Immigrants | Western Asia | 95.9 /100 | #115 | Exceptional $90,005 |
| Native Hawaiians | 95.7 /100 | #116 | Exceptional $89,919 |
| Taiwanese | 95.6 /100 | #117 | Exceptional $89,900 |
| Syrians | 95.4 /100 | #118 | Exceptional $89,830 |
| Albanians | 95.2 /100 | #119 | Exceptional $89,744 |
| Immigrants | North Macedonia | 95.2 /100 | #120 | Exceptional $89,741 |
| Ethiopians | 94.9 /100 | #121 | Exceptional $89,640 |
| Pakistanis | 94.8 /100 | #122 | Exceptional $89,638 |
| Immigrants | Zimbabwe | 94.4 /100 | #123 | Exceptional $89,496 |
| Immigrants | Jordan | 94.1 /100 | #124 | Exceptional $89,412 |
| Immigrants | Kuwait | 93.5 /100 | #125 | Exceptional $89,263 |
| Immigrants | Oceania | 92.9 /100 | #126 | Exceptional $89,100 |
| Immigrants | Peru | 92.5 /100 | #127 | Exceptional $89,010 |
| Portuguese | 92.3 /100 | #128 | Exceptional $88,976 |
Demographics Similar to Americans by Median Household Income
In terms of median household income, the demographic groups most similar to Americans are Immigrants from Belize ($75,938, a difference of 0.010%), Guatemalan ($75,961, a difference of 0.040%), German Russian ($75,856, a difference of 0.10%), Immigrants from Jamaica ($75,851, a difference of 0.11%), and Cape Verdean ($75,848, a difference of 0.11%).
| Demographics | Rating | Rank | Median Household Income |
| Spanish American Indians | 0.4 /100 | #259 | Tragic $76,670 |
| Jamaicans | 0.4 /100 | #260 | Tragic $76,583 |
| Immigrants | Grenada | 0.4 /100 | #261 | Tragic $76,517 |
| French American Indians | 0.4 /100 | #262 | Tragic $76,387 |
| Alaskan Athabascans | 0.4 /100 | #263 | Tragic $76,383 |
| Guatemalans | 0.3 /100 | #264 | Tragic $75,961 |
| Immigrants | Belize | 0.3 /100 | #265 | Tragic $75,938 |
| Americans | 0.3 /100 | #266 | Tragic $75,932 |
| German Russians | 0.3 /100 | #267 | Tragic $75,856 |
| Immigrants | Jamaica | 0.3 /100 | #268 | Tragic $75,851 |
| Cape Verdeans | 0.3 /100 | #269 | Tragic $75,848 |
| Hmong | 0.3 /100 | #270 | Tragic $75,839 |
| Pennsylvania Germans | 0.3 /100 | #271 | Tragic $75,814 |
| Somalis | 0.3 /100 | #272 | Tragic $75,782 |
| Liberians | 0.2 /100 | #273 | Tragic $75,667 |