Immigrants from Latin America vs Immigrants from Mexico Median Household Income
COMPARE
Immigrants from Latin America
Immigrants from Mexico
Median Household Income
Median Household Income Comparison
Immigrants from Latin America
Immigrants from Mexico
$75,420
MEDIAN HOUSEHOLD INCOME
0.2/ 100
METRIC RATING
276th/ 347
METRIC RANK
$73,160
MEDIAN HOUSEHOLD INCOME
0.0/ 100
METRIC RATING
297th/ 347
METRIC RANK
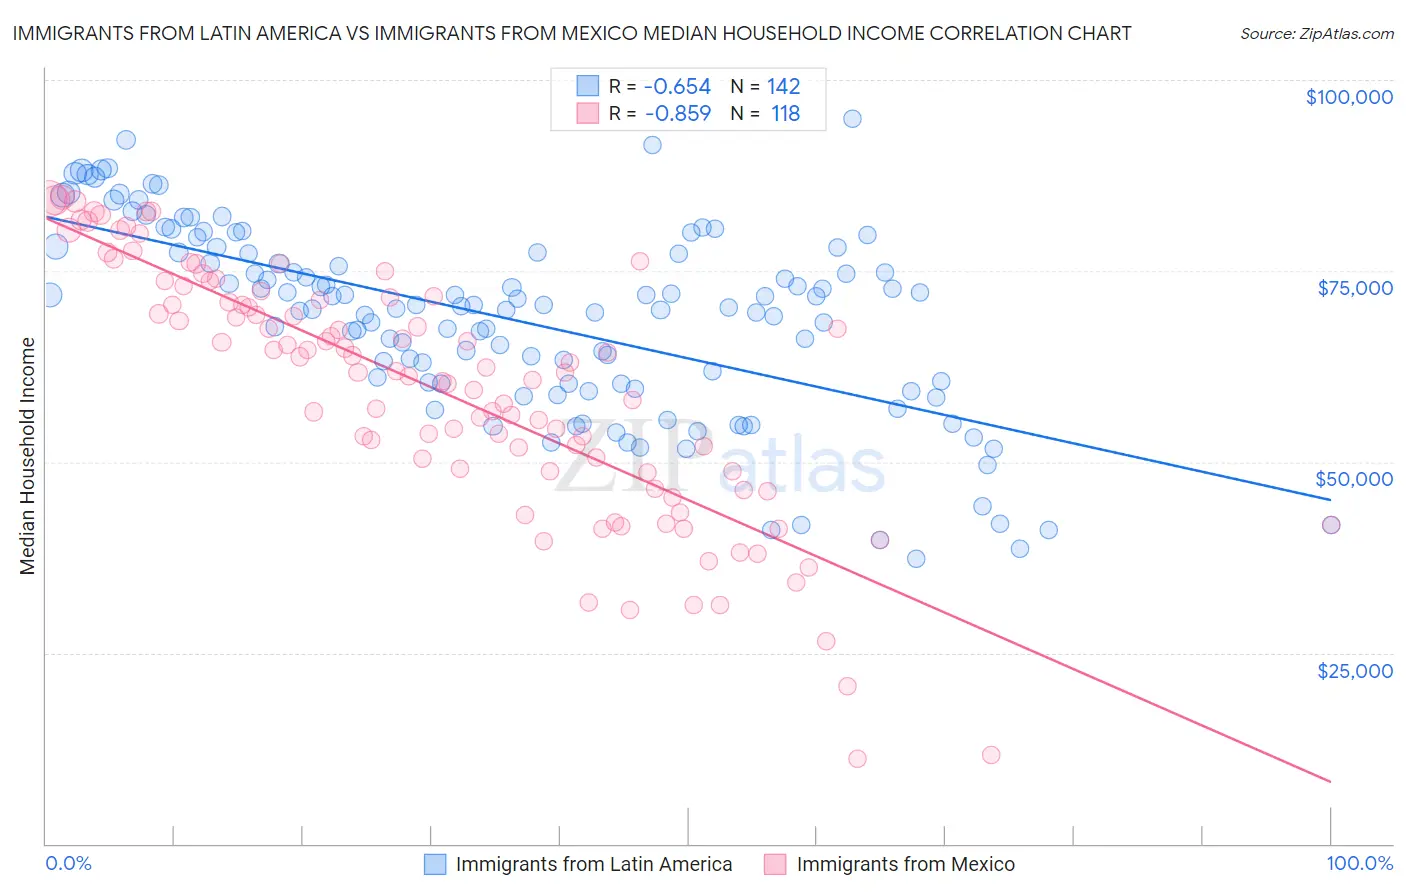
Immigrants from Latin America vs Immigrants from Mexico Median Household Income Correlation Chart
The statistical analysis conducted on geographies consisting of 557,585,131 people shows a significant negative correlation between the proportion of Immigrants from Latin America and median household income in the United States with a correlation coefficient (R) of -0.654 and weighted average of $75,420. Similarly, the statistical analysis conducted on geographies consisting of 513,131,801 people shows a very strong negative correlation between the proportion of Immigrants from Mexico and median household income in the United States with a correlation coefficient (R) of -0.859 and weighted average of $73,160, a difference of 3.1%.
Median Household Income Correlation Summary
| Measurement | Immigrants from Latin America | Immigrants from Mexico |
| Minimum | $37,370 | $11,125 |
| Maximum | $94,905 | $84,609 |
| Range | $57,535 | $73,484 |
| Mean | $68,616 | $59,423 |
| Median | $70,288 | $61,801 |
| Interquartile 25% (IQ1) | $60,228 | $48,735 |
| Interquartile 75% (IQ3) | $77,376 | $71,471 |
| Interquartile Range (IQR) | $17,148 | $22,736 |
| Standard Deviation (Sample) | $12,455 | $16,352 |
| Standard Deviation (Population) | $12,411 | $16,282 |
Similar Demographics by Median Household Income
Demographics Similar to Immigrants from Latin America by Median Household Income
In terms of median household income, the demographic groups most similar to Immigrants from Latin America are Spanish American ($75,386, a difference of 0.040%), Immigrants from Micronesia ($75,574, a difference of 0.20%), Osage ($75,240, a difference of 0.24%), British West Indian ($75,647, a difference of 0.30%), and Liberian ($75,667, a difference of 0.33%).
| Demographics | Rating | Rank | Median Household Income |
| Cape Verdeans | 0.3 /100 | #269 | Tragic $75,848 |
| Hmong | 0.3 /100 | #270 | Tragic $75,839 |
| Pennsylvania Germans | 0.3 /100 | #271 | Tragic $75,814 |
| Somalis | 0.3 /100 | #272 | Tragic $75,782 |
| Liberians | 0.2 /100 | #273 | Tragic $75,667 |
| British West Indians | 0.2 /100 | #274 | Tragic $75,647 |
| Immigrants | Micronesia | 0.2 /100 | #275 | Tragic $75,574 |
| Immigrants | Latin America | 0.2 /100 | #276 | Tragic $75,420 |
| Spanish Americans | 0.2 /100 | #277 | Tragic $75,386 |
| Osage | 0.2 /100 | #278 | Tragic $75,240 |
| Immigrants | Guatemala | 0.2 /100 | #279 | Tragic $75,123 |
| Senegalese | 0.2 /100 | #280 | Tragic $74,999 |
| Immigrants | Liberia | 0.1 /100 | #281 | Tragic $74,896 |
| Central American Indians | 0.1 /100 | #282 | Tragic $74,847 |
| Cree | 0.1 /100 | #283 | Tragic $74,685 |
Demographics Similar to Immigrants from Mexico by Median Household Income
In terms of median household income, the demographic groups most similar to Immigrants from Mexico are Haitian ($73,306, a difference of 0.20%), Paiute ($72,959, a difference of 0.27%), Cuban ($73,392, a difference of 0.32%), Indonesian ($72,856, a difference of 0.42%), and Blackfeet ($73,509, a difference of 0.48%).
| Demographics | Rating | Rank | Median Household Income |
| Bangladeshis | 0.1 /100 | #290 | Tragic $74,112 |
| Hispanics or Latinos | 0.1 /100 | #291 | Tragic $73,823 |
| Comanche | 0.1 /100 | #292 | Tragic $73,747 |
| Immigrants | Cabo Verde | 0.1 /100 | #293 | Tragic $73,515 |
| Blackfeet | 0.1 /100 | #294 | Tragic $73,509 |
| Cubans | 0.1 /100 | #295 | Tragic $73,392 |
| Haitians | 0.1 /100 | #296 | Tragic $73,306 |
| Immigrants | Mexico | 0.0 /100 | #297 | Tragic $73,160 |
| Paiute | 0.0 /100 | #298 | Tragic $72,959 |
| Indonesians | 0.0 /100 | #299 | Tragic $72,856 |
| Immigrants | Dominica | 0.0 /100 | #300 | Tragic $72,760 |
| Cherokee | 0.0 /100 | #301 | Tragic $72,682 |
| Shoshone | 0.0 /100 | #302 | Tragic $72,660 |
| Africans | 0.0 /100 | #303 | Tragic $72,650 |
| Immigrants | Haiti | 0.0 /100 | #304 | Tragic $72,599 |