Czech vs Chippewa Cognitive Disability
COMPARE
Czech
Chippewa
Cognitive Disability
Cognitive Disability Comparison
Czechs
Chippewa
16.4%
COGNITIVE DISABILITY
99.9/ 100
METRIC RATING
30th/ 347
METRIC RANK
18.1%
COGNITIVE DISABILITY
0.1/ 100
METRIC RATING
279th/ 347
METRIC RANK
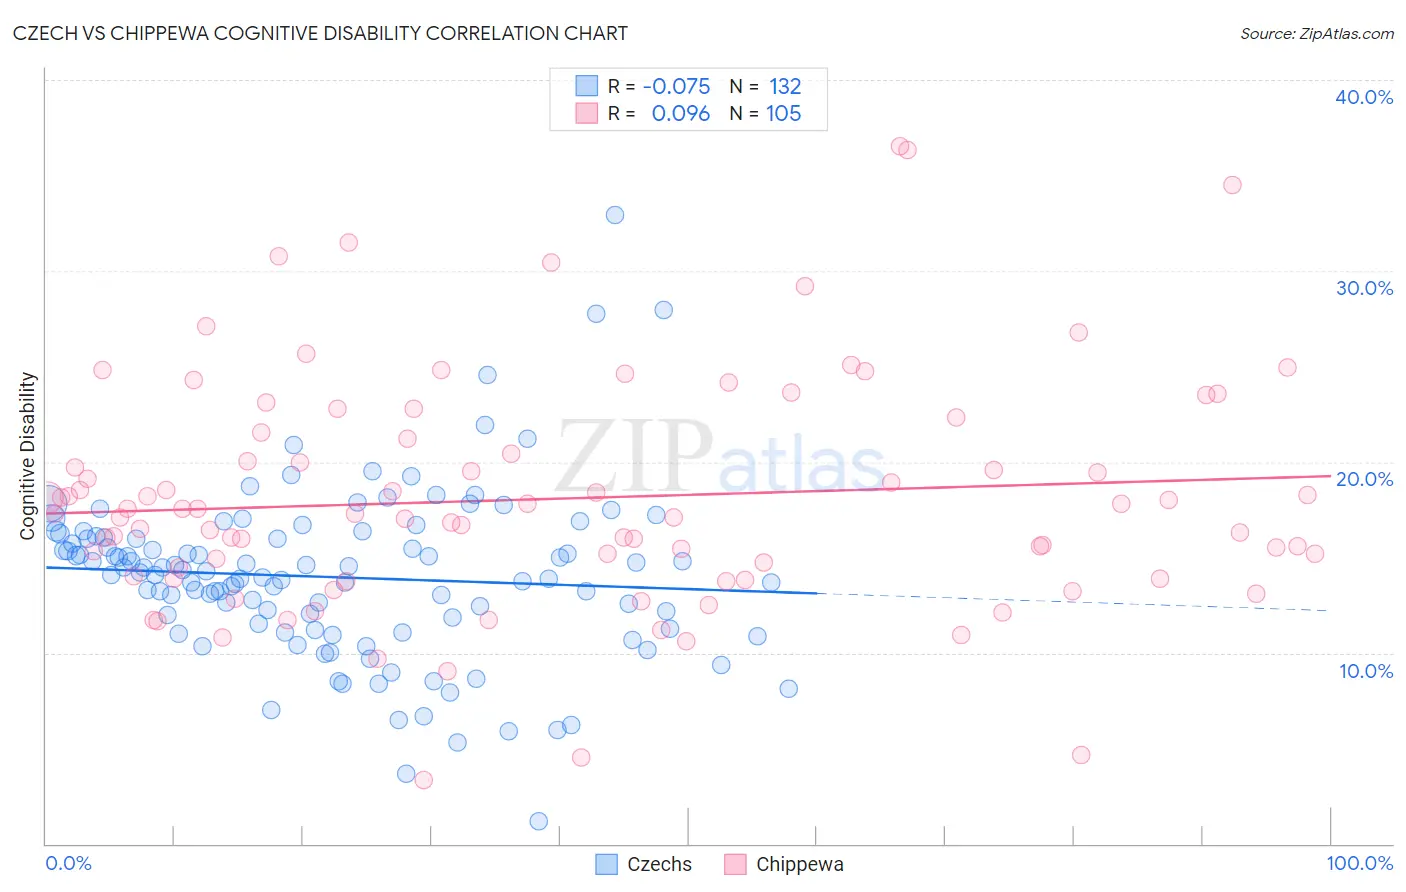
Czech vs Chippewa Cognitive Disability Correlation Chart
The statistical analysis conducted on geographies consisting of 484,743,035 people shows a slight negative correlation between the proportion of Czechs and percentage of population with cognitive disability in the United States with a correlation coefficient (R) of -0.075 and weighted average of 16.4%. Similarly, the statistical analysis conducted on geographies consisting of 215,049,109 people shows a slight positive correlation between the proportion of Chippewa and percentage of population with cognitive disability in the United States with a correlation coefficient (R) of 0.096 and weighted average of 18.1%, a difference of 10.3%.
Cognitive Disability Correlation Summary
| Measurement | Czech | Chippewa |
| Minimum | 1.2% | 3.4% |
| Maximum | 32.9% | 36.6% |
| Range | 31.7% | 33.2% |
| Mean | 14.0% | 18.1% |
| Median | 14.1% | 17.3% |
| Interquartile 25% (IQ1) | 11.4% | 14.0% |
| Interquartile 75% (IQ3) | 16.0% | 21.4% |
| Interquartile Range (IQR) | 4.6% | 7.4% |
| Standard Deviation (Sample) | 4.4% | 6.1% |
| Standard Deviation (Population) | 4.4% | 6.1% |
Similar Demographics by Cognitive Disability
Demographics Similar to Czechs by Cognitive Disability
In terms of cognitive disability, the demographic groups most similar to Czechs are Filipino (16.4%, a difference of 0.0%), Immigrants from Romania (16.4%, a difference of 0.020%), Immigrants from Pakistan (16.4%, a difference of 0.030%), Polish (16.4%, a difference of 0.030%), and Immigrants from Croatia (16.4%, a difference of 0.050%).
| Demographics | Rating | Rank | Cognitive Disability |
| Croatians | 99.9 /100 | #23 | Exceptional 16.4% |
| Immigrants | Argentina | 99.9 /100 | #24 | Exceptional 16.4% |
| Luxembourgers | 99.9 /100 | #25 | Exceptional 16.4% |
| Immigrants | Croatia | 99.9 /100 | #26 | Exceptional 16.4% |
| Immigrants | Pakistan | 99.9 /100 | #27 | Exceptional 16.4% |
| Poles | 99.9 /100 | #28 | Exceptional 16.4% |
| Filipinos | 99.9 /100 | #29 | Exceptional 16.4% |
| Czechs | 99.9 /100 | #30 | Exceptional 16.4% |
| Immigrants | Romania | 99.9 /100 | #31 | Exceptional 16.4% |
| Immigrants | Israel | 99.9 /100 | #32 | Exceptional 16.4% |
| Italians | 99.9 /100 | #33 | Exceptional 16.4% |
| Russians | 99.9 /100 | #34 | Exceptional 16.4% |
| Slovaks | 99.9 /100 | #35 | Exceptional 16.4% |
| Greeks | 99.9 /100 | #36 | Exceptional 16.4% |
| Slovenes | 99.9 /100 | #37 | Exceptional 16.5% |
Demographics Similar to Chippewa by Cognitive Disability
In terms of cognitive disability, the demographic groups most similar to Chippewa are West Indian (18.1%, a difference of 0.010%), Immigrants from Micronesia (18.1%, a difference of 0.050%), Yuman (18.1%, a difference of 0.060%), Immigrants from Kuwait (18.1%, a difference of 0.060%), and Immigrants from Laos (18.1%, a difference of 0.10%).
| Demographics | Rating | Rank | Cognitive Disability |
| Immigrants | Honduras | 0.2 /100 | #272 | Tragic 18.0% |
| Immigrants | Nepal | 0.2 /100 | #273 | Tragic 18.0% |
| Immigrants | Nigeria | 0.2 /100 | #274 | Tragic 18.0% |
| Immigrants | Laos | 0.2 /100 | #275 | Tragic 18.1% |
| Yuman | 0.2 /100 | #276 | Tragic 18.1% |
| Immigrants | Kuwait | 0.2 /100 | #277 | Tragic 18.1% |
| Immigrants | Micronesia | 0.2 /100 | #278 | Tragic 18.1% |
| Chippewa | 0.1 /100 | #279 | Tragic 18.1% |
| West Indians | 0.1 /100 | #280 | Tragic 18.1% |
| Yakama | 0.1 /100 | #281 | Tragic 18.1% |
| Immigrants | Cambodia | 0.1 /100 | #282 | Tragic 18.1% |
| Nigerians | 0.1 /100 | #283 | Tragic 18.1% |
| Immigrants | Uganda | 0.1 /100 | #284 | Tragic 18.1% |
| Bermudans | 0.1 /100 | #285 | Tragic 18.1% |
| Kenyans | 0.1 /100 | #286 | Tragic 18.1% |