Czech vs Chippewa Unemployment Among Ages 16 to 19 years
COMPARE
Czech
Chippewa
Unemployment Among Ages 16 to 19 years
Unemployment Among Ages 16 to 19 years Comparison
Czechs
Chippewa
15.4%
UNEMPLOYMENT AMONG AGES 16 TO 19 YEARS
100.0/ 100
METRIC RATING
8th/ 347
METRIC RANK
18.0%
UNEMPLOYMENT AMONG AGES 16 TO 19 YEARS
13.7/ 100
METRIC RATING
213th/ 347
METRIC RANK
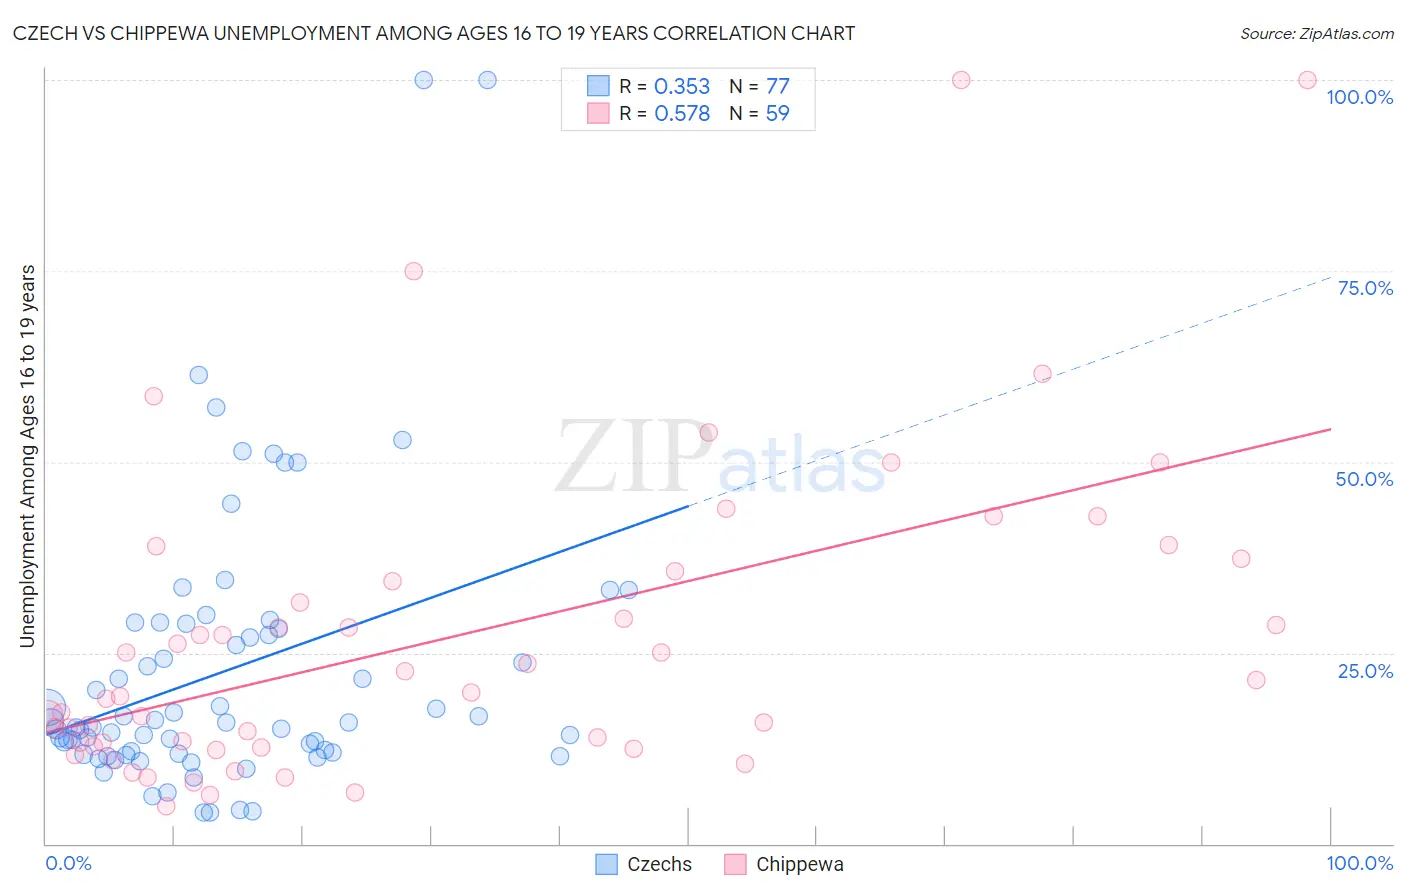
Czech vs Chippewa Unemployment Among Ages 16 to 19 years Correlation Chart
The statistical analysis conducted on geographies consisting of 445,681,187 people shows a mild positive correlation between the proportion of Czechs and unemployment rate among population between the ages 16 and 19 in the United States with a correlation coefficient (R) of 0.353 and weighted average of 15.4%. Similarly, the statistical analysis conducted on geographies consisting of 207,549,693 people shows a substantial positive correlation between the proportion of Chippewa and unemployment rate among population between the ages 16 and 19 in the United States with a correlation coefficient (R) of 0.578 and weighted average of 18.0%, a difference of 16.8%.
Unemployment Among Ages 16 to 19 years Correlation Summary
| Measurement | Czech | Chippewa |
| Minimum | 4.0% | 4.9% |
| Maximum | 100.0% | 100.0% |
| Range | 96.0% | 95.1% |
| Mean | 22.7% | 27.0% |
| Median | 15.9% | 19.7% |
| Interquartile 25% (IQ1) | 11.8% | 12.7% |
| Interquartile 75% (IQ3) | 28.5% | 35.6% |
| Interquartile Range (IQR) | 16.7% | 22.9% |
| Standard Deviation (Sample) | 18.3% | 20.7% |
| Standard Deviation (Population) | 18.2% | 20.5% |
Similar Demographics by Unemployment Among Ages 16 to 19 years
Demographics Similar to Czechs by Unemployment Among Ages 16 to 19 years
In terms of unemployment among ages 16 to 19 years, the demographic groups most similar to Czechs are Immigrants from Bosnia and Herzegovina (15.3%, a difference of 0.24%), Scandinavian (15.4%, a difference of 0.33%), Swedish (15.3%, a difference of 0.41%), Zimbabwean (15.4%, a difference of 0.44%), and Immigrants from Somalia (15.3%, a difference of 0.68%).
| Demographics | Rating | Rank | Unemployment Among Ages 16 to 19 years |
| Norwegians | 100.0 /100 | #1 | Exceptional 14.5% |
| Immigrants | India | 100.0 /100 | #2 | Exceptional 15.0% |
| Luxembourgers | 100.0 /100 | #3 | Exceptional 15.1% |
| Danes | 100.0 /100 | #4 | Exceptional 15.2% |
| Immigrants | Somalia | 100.0 /100 | #5 | Exceptional 15.3% |
| Swedes | 100.0 /100 | #6 | Exceptional 15.3% |
| Immigrants | Bosnia and Herzegovina | 100.0 /100 | #7 | Exceptional 15.3% |
| Czechs | 100.0 /100 | #8 | Exceptional 15.4% |
| Scandinavians | 100.0 /100 | #9 | Exceptional 15.4% |
| Zimbabweans | 100.0 /100 | #10 | Exceptional 15.4% |
| Indonesians | 100.0 /100 | #11 | Exceptional 15.5% |
| Taiwanese | 100.0 /100 | #12 | Exceptional 15.5% |
| Immigrants | Burma/Myanmar | 100.0 /100 | #13 | Exceptional 15.6% |
| Immigrants | Zaire | 100.0 /100 | #14 | Exceptional 15.6% |
| Yugoslavians | 100.0 /100 | #15 | Exceptional 15.6% |
Demographics Similar to Chippewa by Unemployment Among Ages 16 to 19 years
In terms of unemployment among ages 16 to 19 years, the demographic groups most similar to Chippewa are Argentinean (18.0%, a difference of 0.010%), Immigrants from Morocco (18.0%, a difference of 0.020%), Immigrants from Syria (18.0%, a difference of 0.040%), Guamanian/Chamorro (17.9%, a difference of 0.070%), and Immigrants from Kazakhstan (18.0%, a difference of 0.080%).
| Demographics | Rating | Rank | Unemployment Among Ages 16 to 19 years |
| Immigrants | Southern Europe | 18.9 /100 | #206 | Poor 17.9% |
| Liberians | 18.6 /100 | #207 | Poor 17.9% |
| Hawaiians | 16.8 /100 | #208 | Poor 17.9% |
| Cherokee | 15.7 /100 | #209 | Poor 17.9% |
| Carpatho Rusyns | 15.6 /100 | #210 | Poor 17.9% |
| Guamanians/Chamorros | 14.5 /100 | #211 | Poor 17.9% |
| Argentineans | 13.8 /100 | #212 | Poor 18.0% |
| Chippewa | 13.7 /100 | #213 | Poor 18.0% |
| Immigrants | Morocco | 13.5 /100 | #214 | Poor 18.0% |
| Immigrants | Syria | 13.3 /100 | #215 | Poor 18.0% |
| Immigrants | Kazakhstan | 13.0 /100 | #216 | Poor 18.0% |
| South American Indians | 13.0 /100 | #217 | Poor 18.0% |
| Immigrants | Argentina | 12.5 /100 | #218 | Poor 18.0% |
| Immigrants | Africa | 12.0 /100 | #219 | Poor 18.0% |
| Immigrants | Albania | 11.4 /100 | #220 | Poor 18.0% |