Czech vs Immigrants from Armenia Wage/Income Gap
COMPARE
Czech
Immigrants from Armenia
Wage/Income Gap
Wage/Income Gap Comparison
Czechs
Immigrants from Armenia
29.2%
WAGE/INCOME GAP
0.0/ 100
METRIC RATING
331st/ 347
METRIC RANK
20.7%
WAGE/INCOME GAP
100.0/ 100
METRIC RATING
27th/ 347
METRIC RANK
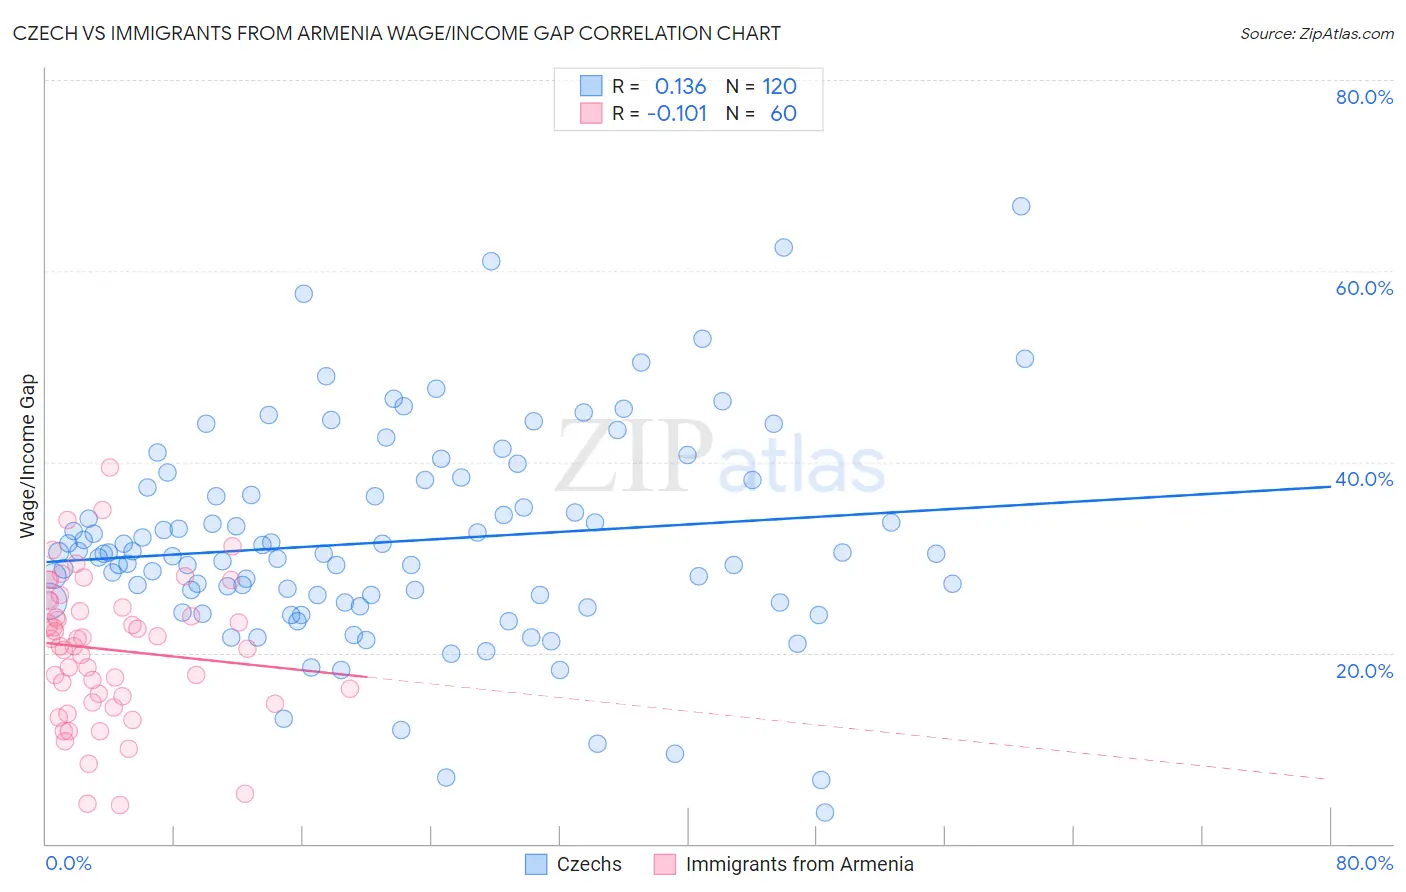
Czech vs Immigrants from Armenia Wage/Income Gap Correlation Chart
The statistical analysis conducted on geographies consisting of 484,001,232 people shows a poor positive correlation between the proportion of Czechs and wage/income gap percentage in the United States with a correlation coefficient (R) of 0.136 and weighted average of 29.2%. Similarly, the statistical analysis conducted on geographies consisting of 97,698,839 people shows a poor negative correlation between the proportion of Immigrants from Armenia and wage/income gap percentage in the United States with a correlation coefficient (R) of -0.101 and weighted average of 20.7%, a difference of 40.8%.
Wage/Income Gap Correlation Summary
| Measurement | Czech | Immigrants from Armenia |
| Minimum | 3.2% | 4.0% |
| Maximum | 66.7% | 39.4% |
| Range | 63.5% | 35.4% |
| Mean | 31.6% | 20.3% |
| Median | 30.4% | 21.1% |
| Interquartile 25% (IQ1) | 25.4% | 15.1% |
| Interquartile 75% (IQ3) | 37.7% | 25.0% |
| Interquartile Range (IQR) | 12.3% | 9.9% |
| Standard Deviation (Sample) | 11.1% | 7.5% |
| Standard Deviation (Population) | 11.0% | 7.4% |
Similar Demographics by Wage/Income Gap
Demographics Similar to Czechs by Wage/Income Gap
In terms of wage/income gap, the demographic groups most similar to Czechs are German (29.2%, a difference of 0.050%), Scottish (29.1%, a difference of 0.15%), Scandinavian (29.1%, a difference of 0.29%), Immigrants from Iran (29.1%, a difference of 0.35%), and Immigrants from Belgium (29.0%, a difference of 0.46%).
| Demographics | Rating | Rank | Wage/Income Gap |
| Croatians | 0.0 /100 | #324 | Tragic 29.0% |
| Hungarians | 0.0 /100 | #325 | Tragic 29.0% |
| Immigrants | Belgium | 0.0 /100 | #326 | Tragic 29.0% |
| Immigrants | Iran | 0.0 /100 | #327 | Tragic 29.1% |
| Scandinavians | 0.0 /100 | #328 | Tragic 29.1% |
| Scottish | 0.0 /100 | #329 | Tragic 29.1% |
| Germans | 0.0 /100 | #330 | Tragic 29.2% |
| Czechs | 0.0 /100 | #331 | Tragic 29.2% |
| Immigrants | South Central Asia | 0.0 /100 | #332 | Tragic 29.3% |
| Europeans | 0.0 /100 | #333 | Tragic 29.4% |
| Swedes | 0.0 /100 | #334 | Tragic 29.4% |
| Immigrants | Taiwan | 0.0 /100 | #335 | Tragic 29.5% |
| English | 0.0 /100 | #336 | Tragic 29.5% |
| Dutch | 0.0 /100 | #337 | Tragic 29.6% |
| Filipinos | 0.0 /100 | #338 | Tragic 29.7% |
Demographics Similar to Immigrants from Armenia by Wage/Income Gap
In terms of wage/income gap, the demographic groups most similar to Immigrants from Armenia are Pueblo (20.7%, a difference of 0.20%), Inupiat (20.8%, a difference of 0.23%), Senegalese (20.7%, a difference of 0.31%), Dominican (20.6%, a difference of 0.62%), and Immigrants from Dominican Republic (20.6%, a difference of 0.78%).
| Demographics | Rating | Rank | Wage/Income Gap |
| Bahamians | 100.0 /100 | #20 | Exceptional 20.2% |
| Immigrants | Caribbean | 100.0 /100 | #21 | Exceptional 20.4% |
| Immigrants | Liberia | 100.0 /100 | #22 | Exceptional 20.6% |
| Immigrants | Dominican Republic | 100.0 /100 | #23 | Exceptional 20.6% |
| Dominicans | 100.0 /100 | #24 | Exceptional 20.6% |
| Senegalese | 100.0 /100 | #25 | Exceptional 20.7% |
| Pueblo | 100.0 /100 | #26 | Exceptional 20.7% |
| Immigrants | Armenia | 100.0 /100 | #27 | Exceptional 20.7% |
| Inupiat | 100.0 /100 | #28 | Exceptional 20.8% |
| Immigrants | Senegal | 100.0 /100 | #29 | Exceptional 20.9% |
| Immigrants | Bangladesh | 100.0 /100 | #30 | Exceptional 20.9% |
| Vietnamese | 100.0 /100 | #31 | Exceptional 21.0% |
| Immigrants | Yemen | 100.0 /100 | #32 | Exceptional 21.1% |
| Immigrants | Bahamas | 100.0 /100 | #33 | Exceptional 21.1% |
| Pima | 100.0 /100 | #34 | Exceptional 21.1% |