Czechoslovakian vs Subsaharan African Median Household Income
COMPARE
Czechoslovakian
Subsaharan African
Median Household Income
Median Household Income Comparison
Czechoslovakians
Sub-Saharan Africans
$84,965
MEDIAN HOUSEHOLD INCOME
47.8/ 100
METRIC RATING
178th/ 347
METRIC RANK
$77,631
MEDIAN HOUSEHOLD INCOME
0.8/ 100
METRIC RATING
254th/ 347
METRIC RANK
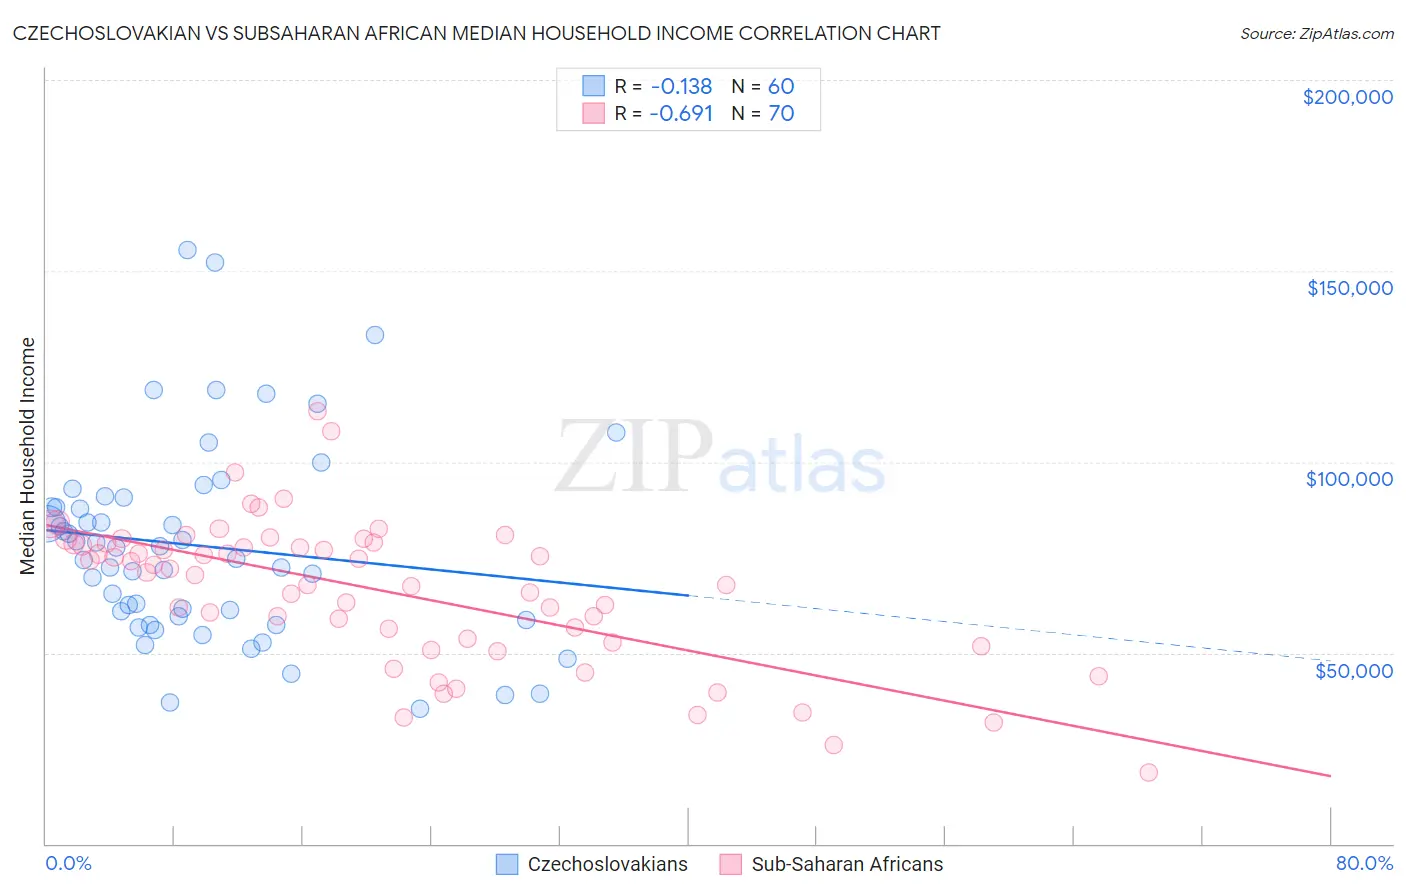
Czechoslovakian vs Subsaharan African Median Household Income Correlation Chart
The statistical analysis conducted on geographies consisting of 368,473,547 people shows a poor negative correlation between the proportion of Czechoslovakians and median household income in the United States with a correlation coefficient (R) of -0.138 and weighted average of $84,965. Similarly, the statistical analysis conducted on geographies consisting of 507,380,534 people shows a significant negative correlation between the proportion of Sub-Saharan Africans and median household income in the United States with a correlation coefficient (R) of -0.691 and weighted average of $77,631, a difference of 9.5%.
Median Household Income Correlation Summary
| Measurement | Czechoslovakian | Subsaharan African |
| Minimum | $35,250 | $18,750 |
| Maximum | $155,633 | $113,418 |
| Range | $120,383 | $94,668 |
| Mean | $77,955 | $66,483 |
| Median | $76,068 | $71,386 |
| Interquartile 25% (IQ1) | $59,148 | $53,589 |
| Interquartile 75% (IQ3) | $89,491 | $78,576 |
| Interquartile Range (IQR) | $30,343 | $24,988 |
| Standard Deviation (Sample) | $26,040 | $18,848 |
| Standard Deviation (Population) | $25,822 | $18,713 |
Similar Demographics by Median Household Income
Demographics Similar to Czechoslovakians by Median Household Income
In terms of median household income, the demographic groups most similar to Czechoslovakians are English ($84,915, a difference of 0.060%), Immigrants from Eritrea ($85,025, a difference of 0.070%), Immigrants from Costa Rica ($85,054, a difference of 0.10%), Alsatian ($85,053, a difference of 0.10%), and Scottish ($85,101, a difference of 0.16%).
| Demographics | Rating | Rank | Median Household Income |
| Immigrants | South America | 58.1 /100 | #171 | Average $85,611 |
| Slovenes | 57.4 /100 | #172 | Average $85,562 |
| Immigrants | Cameroon | 53.4 /100 | #173 | Average $85,314 |
| Scottish | 50.0 /100 | #174 | Average $85,101 |
| Immigrants | Costa Rica | 49.2 /100 | #175 | Average $85,054 |
| Alsatians | 49.2 /100 | #176 | Average $85,053 |
| Immigrants | Eritrea | 48.8 /100 | #177 | Average $85,025 |
| Czechoslovakians | 47.8 /100 | #178 | Average $84,965 |
| English | 47.0 /100 | #179 | Average $84,915 |
| Immigrants | Portugal | 44.2 /100 | #180 | Average $84,740 |
| Hawaiians | 44.1 /100 | #181 | Average $84,729 |
| Uruguayans | 43.5 /100 | #182 | Average $84,691 |
| Spaniards | 42.7 /100 | #183 | Average $84,644 |
| Immigrants | Eastern Africa | 37.4 /100 | #184 | Fair $84,299 |
| Kenyans | 34.2 /100 | #185 | Fair $84,085 |
Demographics Similar to Sub-Saharan Africans by Median Household Income
In terms of median household income, the demographic groups most similar to Sub-Saharan Africans are Immigrants from St. Vincent and the Grenadines ($77,690, a difference of 0.080%), Immigrants from Middle Africa ($77,559, a difference of 0.090%), Immigrants from West Indies ($77,956, a difference of 0.42%), Mexican American Indian ($78,166, a difference of 0.69%), and Belizean ($77,028, a difference of 0.78%).
| Demographics | Rating | Rank | Median Household Income |
| Immigrants | Burma/Myanmar | 1.6 /100 | #247 | Tragic $78,682 |
| Sudanese | 1.5 /100 | #248 | Tragic $78,529 |
| West Indians | 1.4 /100 | #249 | Tragic $78,455 |
| Immigrants | Laos | 1.3 /100 | #250 | Tragic $78,327 |
| Mexican American Indians | 1.2 /100 | #251 | Tragic $78,166 |
| Immigrants | West Indies | 1.0 /100 | #252 | Tragic $77,956 |
| Immigrants | St. Vincent and the Grenadines | 0.9 /100 | #253 | Tragic $77,690 |
| Sub-Saharan Africans | 0.8 /100 | #254 | Tragic $77,631 |
| Immigrants | Middle Africa | 0.8 /100 | #255 | Tragic $77,559 |
| Belizeans | 0.6 /100 | #256 | Tragic $77,028 |
| Immigrants | Senegal | 0.5 /100 | #257 | Tragic $76,915 |
| Immigrants | Nicaragua | 0.5 /100 | #258 | Tragic $76,784 |
| Spanish American Indians | 0.4 /100 | #259 | Tragic $76,670 |
| Jamaicans | 0.4 /100 | #260 | Tragic $76,583 |
| Immigrants | Grenada | 0.4 /100 | #261 | Tragic $76,517 |