Czechoslovakian vs Chinese Median Household Income
COMPARE
Czechoslovakian
Chinese
Median Household Income
Median Household Income Comparison
Czechoslovakians
Chinese
$84,965
MEDIAN HOUSEHOLD INCOME
47.8/ 100
METRIC RATING
178th/ 347
METRIC RANK
$98,496
MEDIAN HOUSEHOLD INCOME
100.0/ 100
METRIC RATING
33rd/ 347
METRIC RANK
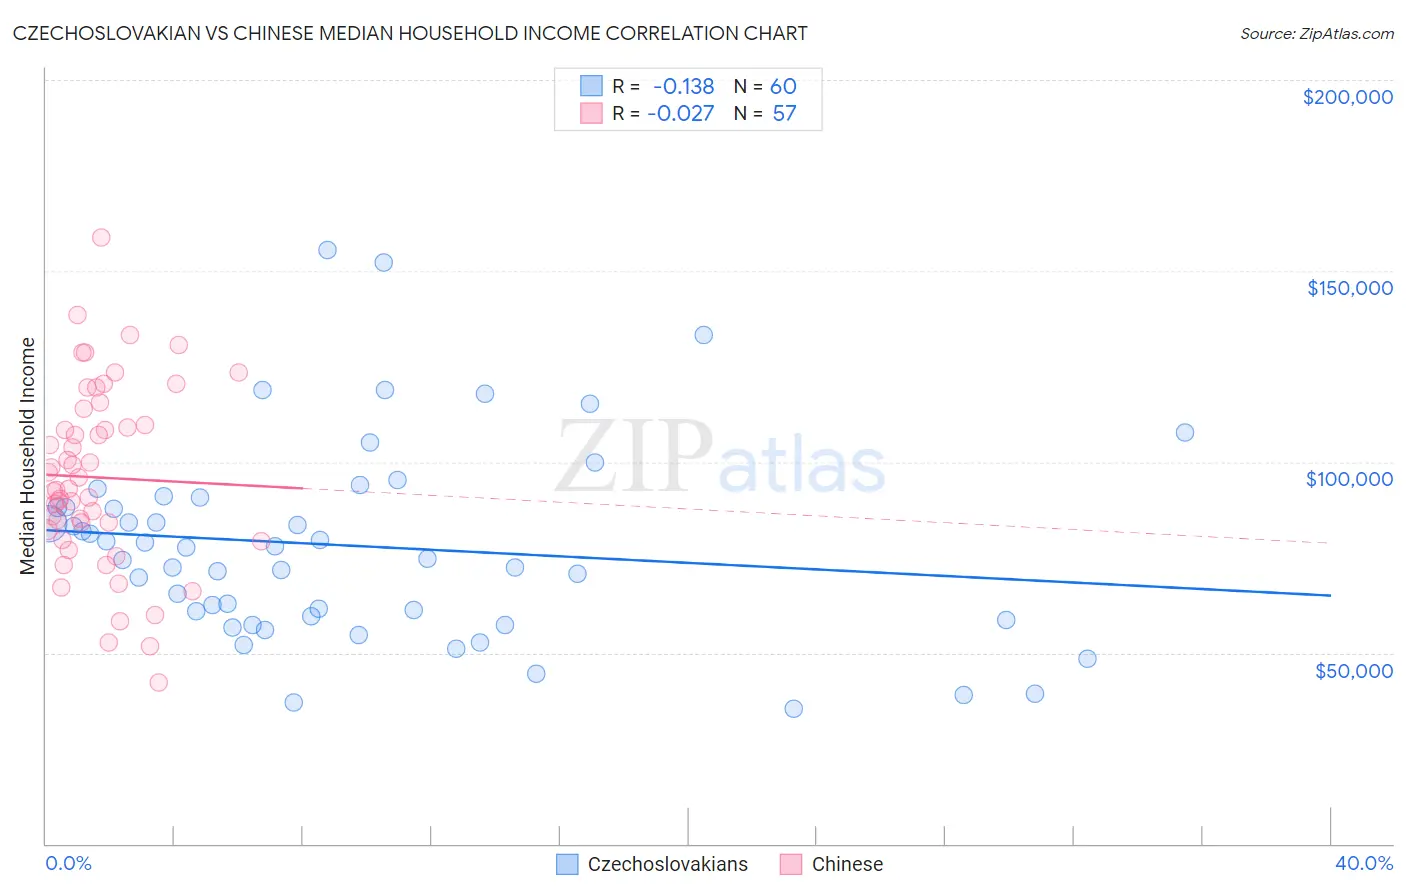
Czechoslovakian vs Chinese Median Household Income Correlation Chart
The statistical analysis conducted on geographies consisting of 368,473,547 people shows a poor negative correlation between the proportion of Czechoslovakians and median household income in the United States with a correlation coefficient (R) of -0.138 and weighted average of $84,965. Similarly, the statistical analysis conducted on geographies consisting of 64,799,903 people shows no correlation between the proportion of Chinese and median household income in the United States with a correlation coefficient (R) of -0.027 and weighted average of $98,496, a difference of 15.9%.
Median Household Income Correlation Summary
| Measurement | Czechoslovakian | Chinese |
| Minimum | $35,250 | $42,222 |
| Maximum | $155,633 | $158,665 |
| Range | $120,383 | $116,443 |
| Mean | $77,955 | $95,906 |
| Median | $76,068 | $92,903 |
| Interquartile 25% (IQ1) | $59,148 | $80,796 |
| Interquartile 75% (IQ3) | $89,491 | $111,792 |
| Interquartile Range (IQR) | $30,343 | $30,996 |
| Standard Deviation (Sample) | $26,040 | $23,711 |
| Standard Deviation (Population) | $25,822 | $23,502 |
Similar Demographics by Median Household Income
Demographics Similar to Czechoslovakians by Median Household Income
In terms of median household income, the demographic groups most similar to Czechoslovakians are English ($84,915, a difference of 0.060%), Immigrants from Eritrea ($85,025, a difference of 0.070%), Immigrants from Costa Rica ($85,054, a difference of 0.10%), Alsatian ($85,053, a difference of 0.10%), and Scottish ($85,101, a difference of 0.16%).
| Demographics | Rating | Rank | Median Household Income |
| Immigrants | South America | 58.1 /100 | #171 | Average $85,611 |
| Slovenes | 57.4 /100 | #172 | Average $85,562 |
| Immigrants | Cameroon | 53.4 /100 | #173 | Average $85,314 |
| Scottish | 50.0 /100 | #174 | Average $85,101 |
| Immigrants | Costa Rica | 49.2 /100 | #175 | Average $85,054 |
| Alsatians | 49.2 /100 | #176 | Average $85,053 |
| Immigrants | Eritrea | 48.8 /100 | #177 | Average $85,025 |
| Czechoslovakians | 47.8 /100 | #178 | Average $84,965 |
| English | 47.0 /100 | #179 | Average $84,915 |
| Immigrants | Portugal | 44.2 /100 | #180 | Average $84,740 |
| Hawaiians | 44.1 /100 | #181 | Average $84,729 |
| Uruguayans | 43.5 /100 | #182 | Average $84,691 |
| Spaniards | 42.7 /100 | #183 | Average $84,644 |
| Immigrants | Eastern Africa | 37.4 /100 | #184 | Fair $84,299 |
| Kenyans | 34.2 /100 | #185 | Fair $84,085 |
Demographics Similar to Chinese by Median Household Income
In terms of median household income, the demographic groups most similar to Chinese are Immigrants from Denmark ($98,510, a difference of 0.010%), Russian ($98,008, a difference of 0.50%), Immigrants from Switzerland ($97,979, a difference of 0.53%), Turkish ($99,389, a difference of 0.91%), and Immigrants from Pakistan ($97,528, a difference of 0.99%).
| Demographics | Rating | Rank | Median Household Income |
| Immigrants | Belgium | 100.0 /100 | #26 | Exceptional $100,306 |
| Bhutanese | 100.0 /100 | #27 | Exceptional $100,151 |
| Immigrants | Sri Lanka | 100.0 /100 | #28 | Exceptional $99,943 |
| Immigrants | Asia | 100.0 /100 | #29 | Exceptional $99,933 |
| Immigrants | Northern Europe | 100.0 /100 | #30 | Exceptional $99,813 |
| Turks | 100.0 /100 | #31 | Exceptional $99,389 |
| Immigrants | Denmark | 100.0 /100 | #32 | Exceptional $98,510 |
| Chinese | 100.0 /100 | #33 | Exceptional $98,496 |
| Russians | 100.0 /100 | #34 | Exceptional $98,008 |
| Immigrants | Switzerland | 100.0 /100 | #35 | Exceptional $97,979 |
| Immigrants | Pakistan | 100.0 /100 | #36 | Exceptional $97,528 |
| Latvians | 100.0 /100 | #37 | Exceptional $97,311 |
| Immigrants | Indonesia | 100.0 /100 | #38 | Exceptional $97,297 |
| Afghans | 100.0 /100 | #39 | Exceptional $97,026 |
| Maltese | 100.0 /100 | #40 | Exceptional $97,015 |