Czechoslovakian vs Albanian Median Household Income
COMPARE
Czechoslovakian
Albanian
Median Household Income
Median Household Income Comparison
Czechoslovakians
Albanians
$84,965
MEDIAN HOUSEHOLD INCOME
47.8/ 100
METRIC RATING
178th/ 347
METRIC RANK
$89,744
MEDIAN HOUSEHOLD INCOME
95.2/ 100
METRIC RATING
119th/ 347
METRIC RANK
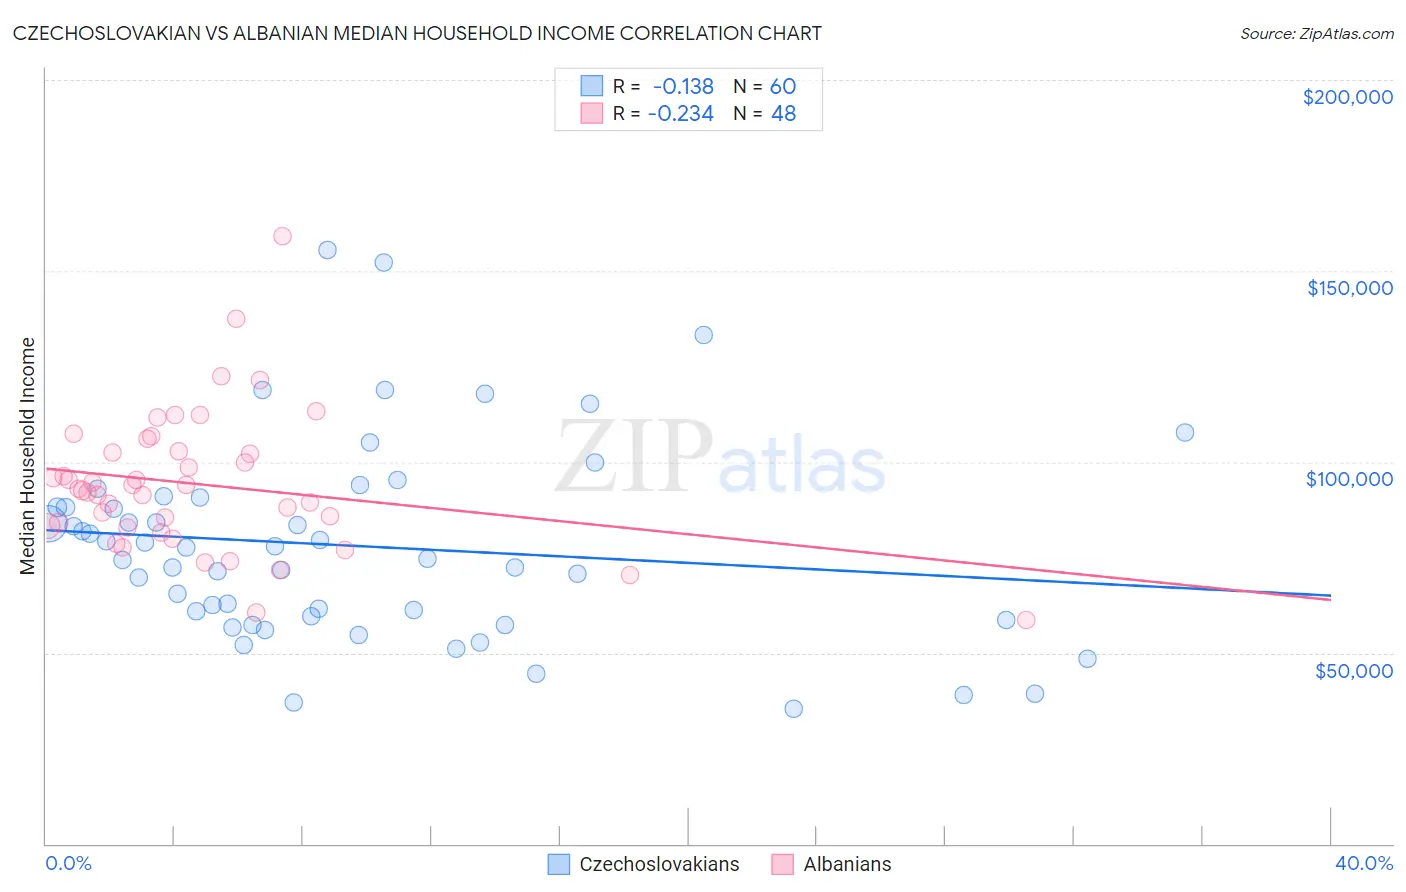
Czechoslovakian vs Albanian Median Household Income Correlation Chart
The statistical analysis conducted on geographies consisting of 368,473,547 people shows a poor negative correlation between the proportion of Czechoslovakians and median household income in the United States with a correlation coefficient (R) of -0.138 and weighted average of $84,965. Similarly, the statistical analysis conducted on geographies consisting of 193,153,779 people shows a weak negative correlation between the proportion of Albanians and median household income in the United States with a correlation coefficient (R) of -0.234 and weighted average of $89,744, a difference of 5.6%.
Median Household Income Correlation Summary
| Measurement | Czechoslovakian | Albanian |
| Minimum | $35,250 | $58,625 |
| Maximum | $155,633 | $159,242 |
| Range | $120,383 | $100,617 |
| Mean | $77,955 | $94,169 |
| Median | $76,068 | $92,779 |
| Interquartile 25% (IQ1) | $59,148 | $83,032 |
| Interquartile 75% (IQ3) | $89,491 | $102,632 |
| Interquartile Range (IQR) | $30,343 | $19,600 |
| Standard Deviation (Sample) | $26,040 | $18,349 |
| Standard Deviation (Population) | $25,822 | $18,157 |
Similar Demographics by Median Household Income
Demographics Similar to Czechoslovakians by Median Household Income
In terms of median household income, the demographic groups most similar to Czechoslovakians are English ($84,915, a difference of 0.060%), Immigrants from Eritrea ($85,025, a difference of 0.070%), Immigrants from Costa Rica ($85,054, a difference of 0.10%), Alsatian ($85,053, a difference of 0.10%), and Scottish ($85,101, a difference of 0.16%).
| Demographics | Rating | Rank | Median Household Income |
| Immigrants | South America | 58.1 /100 | #171 | Average $85,611 |
| Slovenes | 57.4 /100 | #172 | Average $85,562 |
| Immigrants | Cameroon | 53.4 /100 | #173 | Average $85,314 |
| Scottish | 50.0 /100 | #174 | Average $85,101 |
| Immigrants | Costa Rica | 49.2 /100 | #175 | Average $85,054 |
| Alsatians | 49.2 /100 | #176 | Average $85,053 |
| Immigrants | Eritrea | 48.8 /100 | #177 | Average $85,025 |
| Czechoslovakians | 47.8 /100 | #178 | Average $84,965 |
| English | 47.0 /100 | #179 | Average $84,915 |
| Immigrants | Portugal | 44.2 /100 | #180 | Average $84,740 |
| Hawaiians | 44.1 /100 | #181 | Average $84,729 |
| Uruguayans | 43.5 /100 | #182 | Average $84,691 |
| Spaniards | 42.7 /100 | #183 | Average $84,644 |
| Immigrants | Eastern Africa | 37.4 /100 | #184 | Fair $84,299 |
| Kenyans | 34.2 /100 | #185 | Fair $84,085 |
Demographics Similar to Albanians by Median Household Income
In terms of median household income, the demographic groups most similar to Albanians are Immigrants from North Macedonia ($89,741, a difference of 0.0%), Syrian ($89,830, a difference of 0.10%), Ethiopian ($89,640, a difference of 0.12%), Pakistani ($89,638, a difference of 0.12%), and Taiwanese ($89,900, a difference of 0.17%).
| Demographics | Rating | Rank | Median Household Income |
| Northern Europeans | 96.9 /100 | #112 | Exceptional $90,446 |
| Peruvians | 96.5 /100 | #113 | Exceptional $90,261 |
| Immigrants | Northern Africa | 95.9 /100 | #114 | Exceptional $90,026 |
| Immigrants | Western Asia | 95.9 /100 | #115 | Exceptional $90,005 |
| Native Hawaiians | 95.7 /100 | #116 | Exceptional $89,919 |
| Taiwanese | 95.6 /100 | #117 | Exceptional $89,900 |
| Syrians | 95.4 /100 | #118 | Exceptional $89,830 |
| Albanians | 95.2 /100 | #119 | Exceptional $89,744 |
| Immigrants | North Macedonia | 95.2 /100 | #120 | Exceptional $89,741 |
| Ethiopians | 94.9 /100 | #121 | Exceptional $89,640 |
| Pakistanis | 94.8 /100 | #122 | Exceptional $89,638 |
| Immigrants | Zimbabwe | 94.4 /100 | #123 | Exceptional $89,496 |
| Immigrants | Jordan | 94.1 /100 | #124 | Exceptional $89,412 |
| Immigrants | Kuwait | 93.5 /100 | #125 | Exceptional $89,263 |
| Immigrants | Oceania | 92.9 /100 | #126 | Exceptional $89,100 |