Czechoslovakian vs Immigrants from Scotland Median Household Income
COMPARE
Czechoslovakian
Immigrants from Scotland
Median Household Income
Median Household Income Comparison
Czechoslovakians
Immigrants from Scotland
$84,965
MEDIAN HOUSEHOLD INCOME
47.8/ 100
METRIC RATING
178th/ 347
METRIC RANK
$94,091
MEDIAN HOUSEHOLD INCOME
99.7/ 100
METRIC RATING
67th/ 347
METRIC RANK
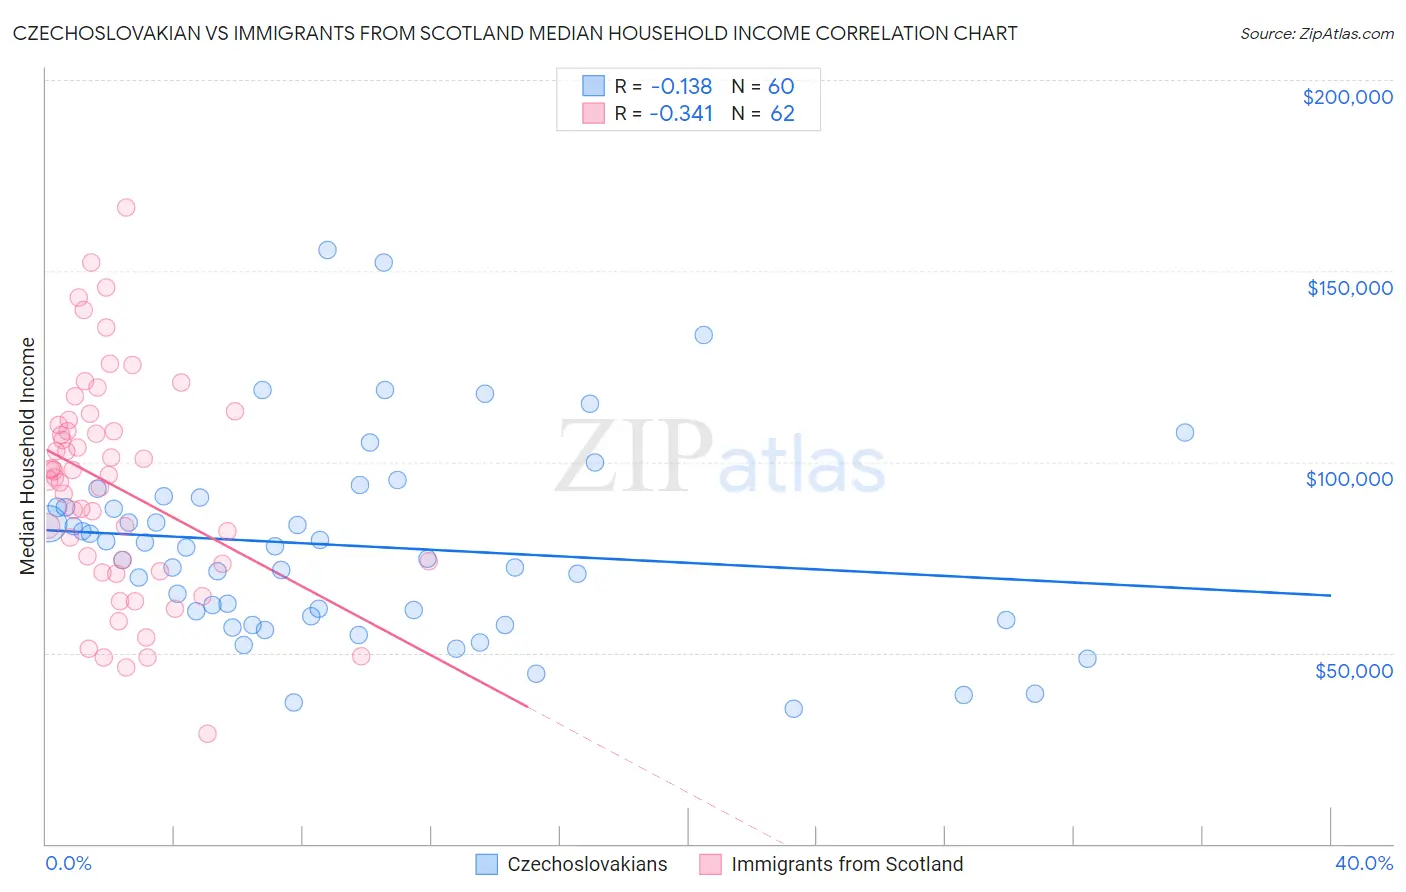
Czechoslovakian vs Immigrants from Scotland Median Household Income Correlation Chart
The statistical analysis conducted on geographies consisting of 368,473,547 people shows a poor negative correlation between the proportion of Czechoslovakians and median household income in the United States with a correlation coefficient (R) of -0.138 and weighted average of $84,965. Similarly, the statistical analysis conducted on geographies consisting of 196,370,497 people shows a mild negative correlation between the proportion of Immigrants from Scotland and median household income in the United States with a correlation coefficient (R) of -0.341 and weighted average of $94,091, a difference of 10.7%.
Median Household Income Correlation Summary
| Measurement | Czechoslovakian | Immigrants from Scotland |
| Minimum | $35,250 | $28,750 |
| Maximum | $155,633 | $166,597 |
| Range | $120,383 | $137,847 |
| Mean | $77,955 | $93,595 |
| Median | $76,068 | $96,232 |
| Interquartile 25% (IQ1) | $59,148 | $73,269 |
| Interquartile 75% (IQ3) | $89,491 | $109,596 |
| Interquartile Range (IQR) | $30,343 | $36,327 |
| Standard Deviation (Sample) | $26,040 | $28,531 |
| Standard Deviation (Population) | $25,822 | $28,300 |
Similar Demographics by Median Household Income
Demographics Similar to Czechoslovakians by Median Household Income
In terms of median household income, the demographic groups most similar to Czechoslovakians are English ($84,915, a difference of 0.060%), Immigrants from Eritrea ($85,025, a difference of 0.070%), Immigrants from Costa Rica ($85,054, a difference of 0.10%), Alsatian ($85,053, a difference of 0.10%), and Scottish ($85,101, a difference of 0.16%).
| Demographics | Rating | Rank | Median Household Income |
| Immigrants | South America | 58.1 /100 | #171 | Average $85,611 |
| Slovenes | 57.4 /100 | #172 | Average $85,562 |
| Immigrants | Cameroon | 53.4 /100 | #173 | Average $85,314 |
| Scottish | 50.0 /100 | #174 | Average $85,101 |
| Immigrants | Costa Rica | 49.2 /100 | #175 | Average $85,054 |
| Alsatians | 49.2 /100 | #176 | Average $85,053 |
| Immigrants | Eritrea | 48.8 /100 | #177 | Average $85,025 |
| Czechoslovakians | 47.8 /100 | #178 | Average $84,965 |
| English | 47.0 /100 | #179 | Average $84,915 |
| Immigrants | Portugal | 44.2 /100 | #180 | Average $84,740 |
| Hawaiians | 44.1 /100 | #181 | Average $84,729 |
| Uruguayans | 43.5 /100 | #182 | Average $84,691 |
| Spaniards | 42.7 /100 | #183 | Average $84,644 |
| Immigrants | Eastern Africa | 37.4 /100 | #184 | Fair $84,299 |
| Kenyans | 34.2 /100 | #185 | Fair $84,085 |
Demographics Similar to Immigrants from Scotland by Median Household Income
In terms of median household income, the demographic groups most similar to Immigrants from Scotland are Mongolian ($93,971, a difference of 0.13%), Immigrants from Romania ($94,222, a difference of 0.14%), Argentinean ($93,960, a difference of 0.14%), Immigrants from Fiji ($93,933, a difference of 0.17%), and Immigrants from Philippines ($93,899, a difference of 0.20%).
| Demographics | Rating | Rank | Median Household Income |
| Koreans | 99.8 /100 | #60 | Exceptional $95,018 |
| Laotians | 99.8 /100 | #61 | Exceptional $94,990 |
| Immigrants | Norway | 99.8 /100 | #62 | Exceptional $94,846 |
| Greeks | 99.8 /100 | #63 | Exceptional $94,735 |
| Immigrants | Netherlands | 99.7 /100 | #64 | Exceptional $94,411 |
| Immigrants | Belarus | 99.7 /100 | #65 | Exceptional $94,399 |
| Immigrants | Romania | 99.7 /100 | #66 | Exceptional $94,222 |
| Immigrants | Scotland | 99.7 /100 | #67 | Exceptional $94,091 |
| Mongolians | 99.7 /100 | #68 | Exceptional $93,971 |
| Argentineans | 99.7 /100 | #69 | Exceptional $93,960 |
| Immigrants | Fiji | 99.7 /100 | #70 | Exceptional $93,933 |
| Immigrants | Philippines | 99.6 /100 | #71 | Exceptional $93,899 |
| Lithuanians | 99.6 /100 | #72 | Exceptional $93,852 |
| Immigrants | Egypt | 99.6 /100 | #73 | Exceptional $93,700 |
| Immigrants | Latvia | 99.6 /100 | #74 | Exceptional $93,602 |