Czechoslovakian vs German Median Household Income
COMPARE
Czechoslovakian
German
Median Household Income
Median Household Income Comparison
Czechoslovakians
Germans
$84,965
MEDIAN HOUSEHOLD INCOME
47.8/ 100
METRIC RATING
178th/ 347
METRIC RANK
$83,358
MEDIAN HOUSEHOLD INCOME
24.6/ 100
METRIC RATING
199th/ 347
METRIC RANK
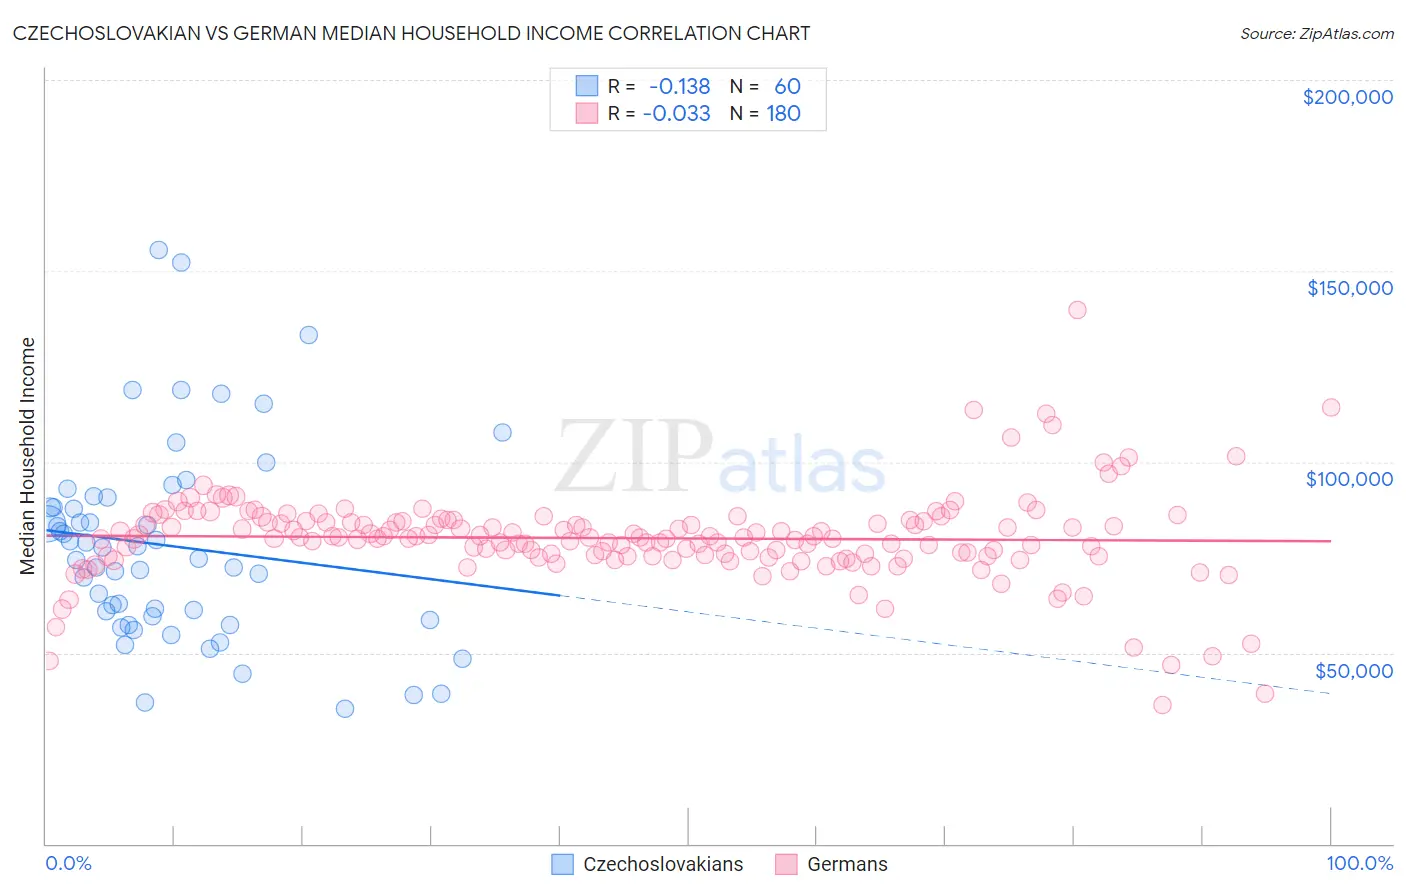
Czechoslovakian vs German Median Household Income Correlation Chart
The statistical analysis conducted on geographies consisting of 368,473,547 people shows a poor negative correlation between the proportion of Czechoslovakians and median household income in the United States with a correlation coefficient (R) of -0.138 and weighted average of $84,965. Similarly, the statistical analysis conducted on geographies consisting of 579,647,874 people shows no correlation between the proportion of Germans and median household income in the United States with a correlation coefficient (R) of -0.033 and weighted average of $83,358, a difference of 1.9%.
Median Household Income Correlation Summary
| Measurement | Czechoslovakian | German |
| Minimum | $35,250 | $36,331 |
| Maximum | $155,633 | $139,709 |
| Range | $120,383 | $103,378 |
| Mean | $77,955 | $80,014 |
| Median | $76,068 | $80,167 |
| Interquartile 25% (IQ1) | $59,148 | $75,354 |
| Interquartile 75% (IQ3) | $89,491 | $84,522 |
| Interquartile Range (IQR) | $30,343 | $9,168 |
| Standard Deviation (Sample) | $26,040 | $11,898 |
| Standard Deviation (Population) | $25,822 | $11,865 |
Similar Demographics by Median Household Income
Demographics Similar to Czechoslovakians by Median Household Income
In terms of median household income, the demographic groups most similar to Czechoslovakians are English ($84,915, a difference of 0.060%), Immigrants from Eritrea ($85,025, a difference of 0.070%), Immigrants from Costa Rica ($85,054, a difference of 0.10%), Alsatian ($85,053, a difference of 0.10%), and Scottish ($85,101, a difference of 0.16%).
| Demographics | Rating | Rank | Median Household Income |
| Immigrants | South America | 58.1 /100 | #171 | Average $85,611 |
| Slovenes | 57.4 /100 | #172 | Average $85,562 |
| Immigrants | Cameroon | 53.4 /100 | #173 | Average $85,314 |
| Scottish | 50.0 /100 | #174 | Average $85,101 |
| Immigrants | Costa Rica | 49.2 /100 | #175 | Average $85,054 |
| Alsatians | 49.2 /100 | #176 | Average $85,053 |
| Immigrants | Eritrea | 48.8 /100 | #177 | Average $85,025 |
| Czechoslovakians | 47.8 /100 | #178 | Average $84,965 |
| English | 47.0 /100 | #179 | Average $84,915 |
| Immigrants | Portugal | 44.2 /100 | #180 | Average $84,740 |
| Hawaiians | 44.1 /100 | #181 | Average $84,729 |
| Uruguayans | 43.5 /100 | #182 | Average $84,691 |
| Spaniards | 42.7 /100 | #183 | Average $84,644 |
| Immigrants | Eastern Africa | 37.4 /100 | #184 | Fair $84,299 |
| Kenyans | 34.2 /100 | #185 | Fair $84,085 |
Demographics Similar to Germans by Median Household Income
In terms of median household income, the demographic groups most similar to Germans are Tsimshian ($83,346, a difference of 0.010%), Spanish ($83,343, a difference of 0.020%), Japanese ($83,395, a difference of 0.040%), Immigrants from Thailand ($83,327, a difference of 0.040%), and Immigrants from Cambodia ($83,304, a difference of 0.070%).
| Demographics | Rating | Rank | Median Household Income |
| Welsh | 28.0 /100 | #192 | Fair $83,628 |
| Finns | 27.7 /100 | #193 | Fair $83,607 |
| Ghanaians | 27.4 /100 | #194 | Fair $83,582 |
| Immigrants | Armenia | 27.0 /100 | #195 | Fair $83,555 |
| French | 26.0 /100 | #196 | Fair $83,468 |
| Aleuts | 25.7 /100 | #197 | Fair $83,446 |
| Japanese | 25.1 /100 | #198 | Fair $83,395 |
| Germans | 24.6 /100 | #199 | Fair $83,358 |
| Tsimshian | 24.5 /100 | #200 | Fair $83,346 |
| Spanish | 24.4 /100 | #201 | Fair $83,343 |
| Immigrants | Thailand | 24.3 /100 | #202 | Fair $83,327 |
| Immigrants | Cambodia | 24.0 /100 | #203 | Fair $83,304 |
| Immigrants | Africa | 23.8 /100 | #204 | Fair $83,289 |
| Celtics | 22.7 /100 | #205 | Fair $83,193 |
| Immigrants | Kenya | 21.3 /100 | #206 | Fair $83,068 |