Immigrants from Uruguay vs Subsaharan African Median Household Income
COMPARE
Immigrants from Uruguay
Subsaharan African
Median Household Income
Median Household Income Comparison
Immigrants from Uruguay
Sub-Saharan Africans
$82,560
MEDIAN HOUSEHOLD INCOME
16.4/ 100
METRIC RATING
210th/ 347
METRIC RANK
$77,631
MEDIAN HOUSEHOLD INCOME
0.8/ 100
METRIC RATING
254th/ 347
METRIC RANK
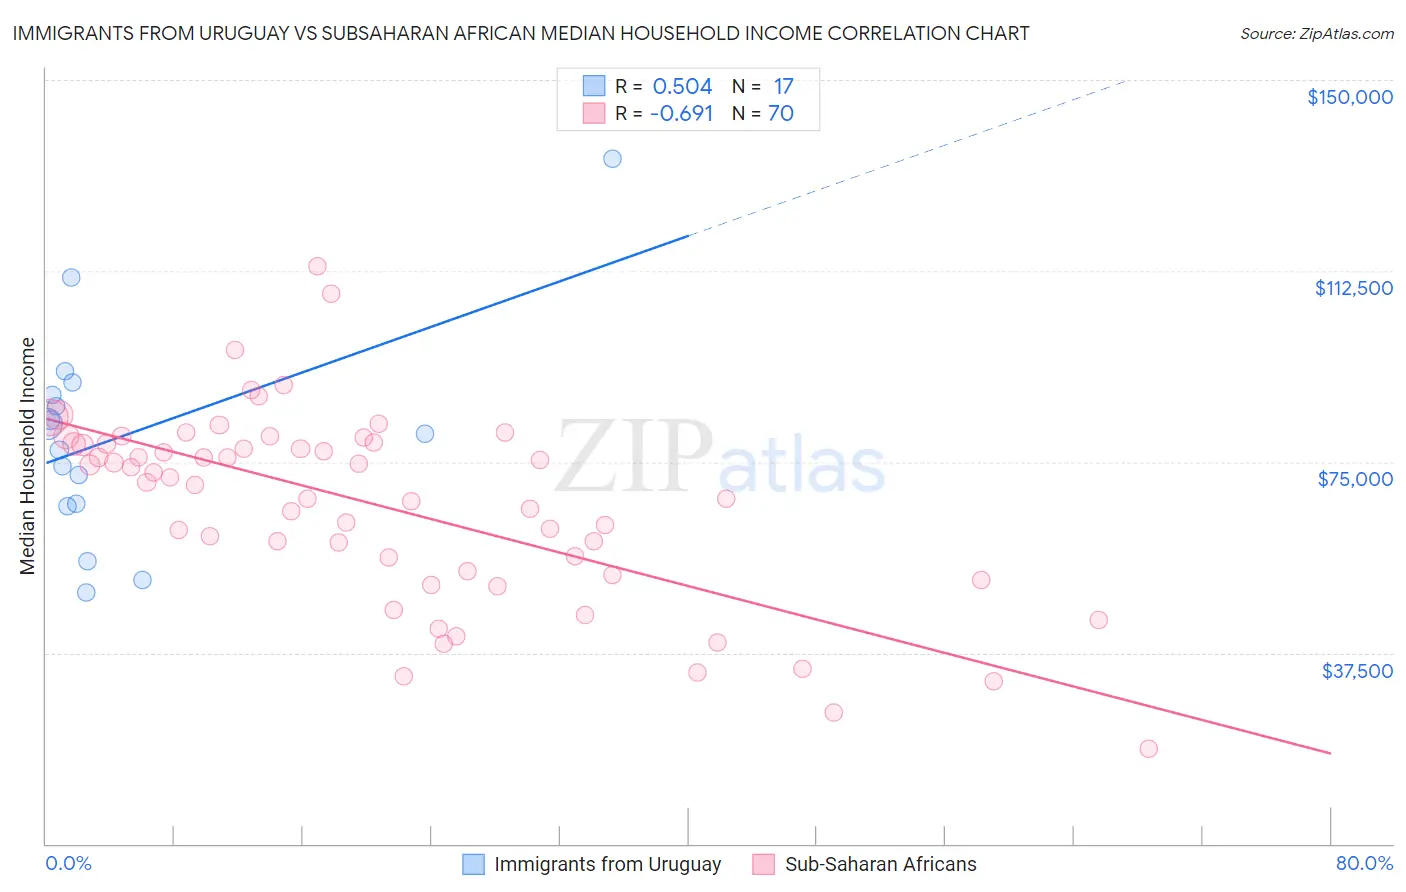
Immigrants from Uruguay vs Subsaharan African Median Household Income Correlation Chart
The statistical analysis conducted on geographies consisting of 133,237,976 people shows a substantial positive correlation between the proportion of Immigrants from Uruguay and median household income in the United States with a correlation coefficient (R) of 0.504 and weighted average of $82,560. Similarly, the statistical analysis conducted on geographies consisting of 507,380,534 people shows a significant negative correlation between the proportion of Sub-Saharan Africans and median household income in the United States with a correlation coefficient (R) of -0.691 and weighted average of $77,631, a difference of 6.4%.
Median Household Income Correlation Summary
| Measurement | Immigrants from Uruguay | Subsaharan African |
| Minimum | $49,241 | $18,750 |
| Maximum | $134,635 | $113,418 |
| Range | $85,394 | $94,668 |
| Mean | $80,181 | $66,483 |
| Median | $80,417 | $71,386 |
| Interquartile 25% (IQ1) | $66,523 | $53,589 |
| Interquartile 75% (IQ3) | $89,275 | $78,576 |
| Interquartile Range (IQR) | $22,752 | $24,988 |
| Standard Deviation (Sample) | $21,157 | $18,848 |
| Standard Deviation (Population) | $20,525 | $18,713 |
Similar Demographics by Median Household Income
Demographics Similar to Immigrants from Uruguay by Median Household Income
In terms of median household income, the demographic groups most similar to Immigrants from Uruguay are Immigrants from Iraq ($82,594, a difference of 0.040%), Salvadoran ($82,449, a difference of 0.14%), Venezuelan ($82,432, a difference of 0.16%), Nepalese ($82,410, a difference of 0.18%), and French Canadian ($82,810, a difference of 0.30%).
| Demographics | Rating | Rank | Median Household Income |
| Immigrants | Cambodia | 24.0 /100 | #203 | Fair $83,304 |
| Immigrants | Africa | 23.8 /100 | #204 | Fair $83,289 |
| Celtics | 22.7 /100 | #205 | Fair $83,193 |
| Immigrants | Kenya | 21.3 /100 | #206 | Fair $83,068 |
| Dutch | 20.3 /100 | #207 | Fair $82,971 |
| French Canadians | 18.7 /100 | #208 | Poor $82,810 |
| Immigrants | Iraq | 16.7 /100 | #209 | Poor $82,594 |
| Immigrants | Uruguay | 16.4 /100 | #210 | Poor $82,560 |
| Salvadorans | 15.4 /100 | #211 | Poor $82,449 |
| Venezuelans | 15.3 /100 | #212 | Poor $82,432 |
| Nepalese | 15.1 /100 | #213 | Poor $82,410 |
| Panamanians | 14.0 /100 | #214 | Poor $82,272 |
| Vietnamese | 13.8 /100 | #215 | Poor $82,248 |
| Yugoslavians | 13.3 /100 | #216 | Poor $82,186 |
| Ecuadorians | 12.5 /100 | #217 | Poor $82,070 |
Demographics Similar to Sub-Saharan Africans by Median Household Income
In terms of median household income, the demographic groups most similar to Sub-Saharan Africans are Immigrants from St. Vincent and the Grenadines ($77,690, a difference of 0.080%), Immigrants from Middle Africa ($77,559, a difference of 0.090%), Immigrants from West Indies ($77,956, a difference of 0.42%), Mexican American Indian ($78,166, a difference of 0.69%), and Belizean ($77,028, a difference of 0.78%).
| Demographics | Rating | Rank | Median Household Income |
| Immigrants | Burma/Myanmar | 1.6 /100 | #247 | Tragic $78,682 |
| Sudanese | 1.5 /100 | #248 | Tragic $78,529 |
| West Indians | 1.4 /100 | #249 | Tragic $78,455 |
| Immigrants | Laos | 1.3 /100 | #250 | Tragic $78,327 |
| Mexican American Indians | 1.2 /100 | #251 | Tragic $78,166 |
| Immigrants | West Indies | 1.0 /100 | #252 | Tragic $77,956 |
| Immigrants | St. Vincent and the Grenadines | 0.9 /100 | #253 | Tragic $77,690 |
| Sub-Saharan Africans | 0.8 /100 | #254 | Tragic $77,631 |
| Immigrants | Middle Africa | 0.8 /100 | #255 | Tragic $77,559 |
| Belizeans | 0.6 /100 | #256 | Tragic $77,028 |
| Immigrants | Senegal | 0.5 /100 | #257 | Tragic $76,915 |
| Immigrants | Nicaragua | 0.5 /100 | #258 | Tragic $76,784 |
| Spanish American Indians | 0.4 /100 | #259 | Tragic $76,670 |
| Jamaicans | 0.4 /100 | #260 | Tragic $76,583 |
| Immigrants | Grenada | 0.4 /100 | #261 | Tragic $76,517 |