Czechoslovakian vs Nigerian Median Household Income
COMPARE
Czechoslovakian
Nigerian
Median Household Income
Median Household Income Comparison
Czechoslovakians
Nigerians
$84,965
MEDIAN HOUSEHOLD INCOME
47.8/ 100
METRIC RATING
178th/ 347
METRIC RANK
$81,725
MEDIAN HOUSEHOLD INCOME
10.3/ 100
METRIC RATING
219th/ 347
METRIC RANK
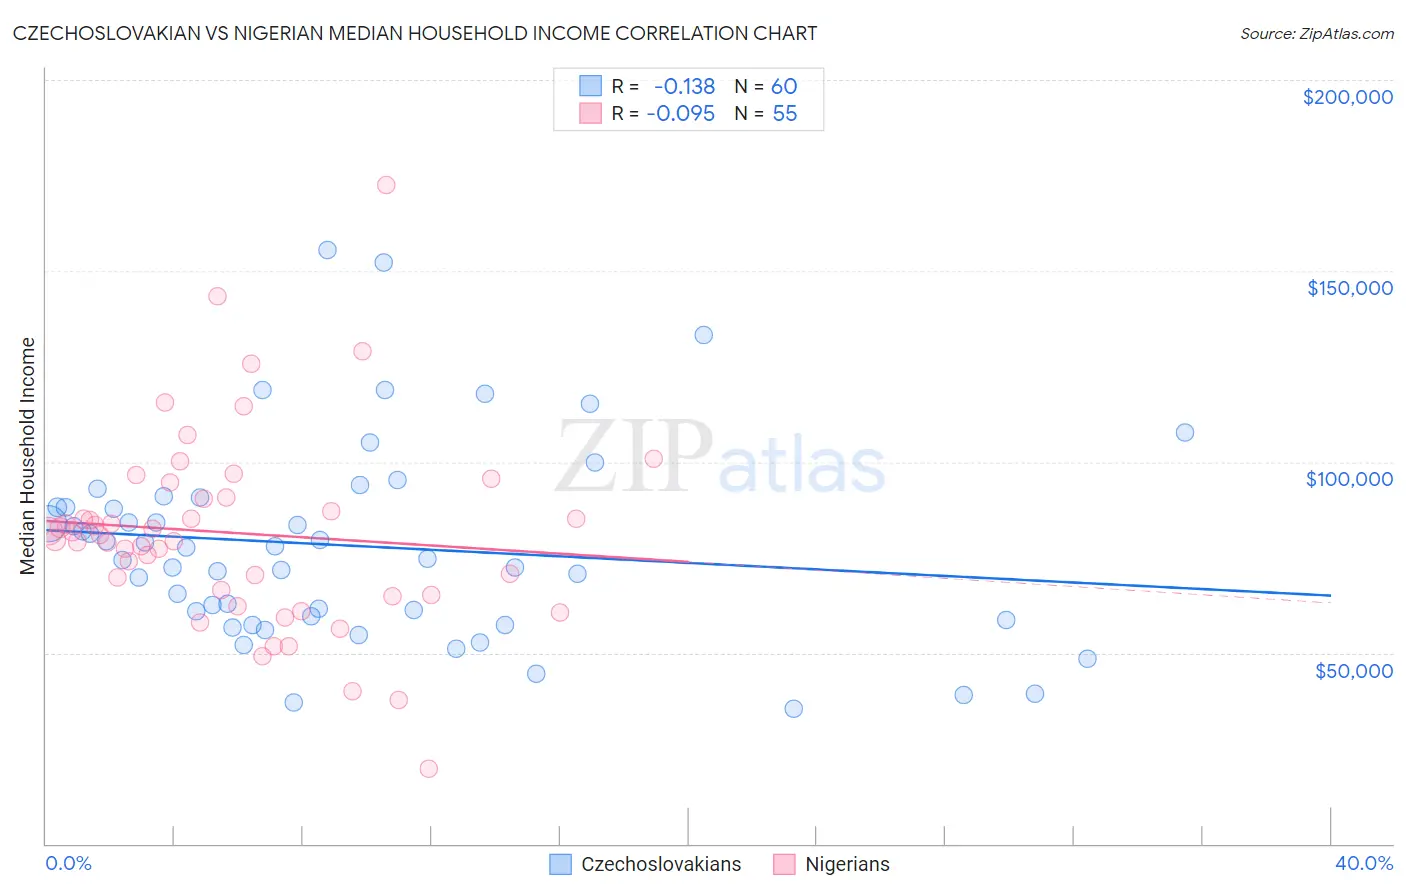
Czechoslovakian vs Nigerian Median Household Income Correlation Chart
The statistical analysis conducted on geographies consisting of 368,473,547 people shows a poor negative correlation between the proportion of Czechoslovakians and median household income in the United States with a correlation coefficient (R) of -0.138 and weighted average of $84,965. Similarly, the statistical analysis conducted on geographies consisting of 332,385,010 people shows a slight negative correlation between the proportion of Nigerians and median household income in the United States with a correlation coefficient (R) of -0.095 and weighted average of $81,725, a difference of 4.0%.
Median Household Income Correlation Summary
| Measurement | Czechoslovakian | Nigerian |
| Minimum | $35,250 | $19,722 |
| Maximum | $155,633 | $172,388 |
| Range | $120,383 | $152,666 |
| Mean | $77,955 | $81,339 |
| Median | $76,068 | $80,919 |
| Interquartile 25% (IQ1) | $59,148 | $65,240 |
| Interquartile 75% (IQ3) | $89,491 | $90,601 |
| Interquartile Range (IQR) | $30,343 | $25,361 |
| Standard Deviation (Sample) | $26,040 | $25,635 |
| Standard Deviation (Population) | $25,822 | $25,401 |
Similar Demographics by Median Household Income
Demographics Similar to Czechoslovakians by Median Household Income
In terms of median household income, the demographic groups most similar to Czechoslovakians are English ($84,915, a difference of 0.060%), Immigrants from Eritrea ($85,025, a difference of 0.070%), Immigrants from Costa Rica ($85,054, a difference of 0.10%), Alsatian ($85,053, a difference of 0.10%), and Scottish ($85,101, a difference of 0.16%).
| Demographics | Rating | Rank | Median Household Income |
| Immigrants | South America | 58.1 /100 | #171 | Average $85,611 |
| Slovenes | 57.4 /100 | #172 | Average $85,562 |
| Immigrants | Cameroon | 53.4 /100 | #173 | Average $85,314 |
| Scottish | 50.0 /100 | #174 | Average $85,101 |
| Immigrants | Costa Rica | 49.2 /100 | #175 | Average $85,054 |
| Alsatians | 49.2 /100 | #176 | Average $85,053 |
| Immigrants | Eritrea | 48.8 /100 | #177 | Average $85,025 |
| Czechoslovakians | 47.8 /100 | #178 | Average $84,965 |
| English | 47.0 /100 | #179 | Average $84,915 |
| Immigrants | Portugal | 44.2 /100 | #180 | Average $84,740 |
| Hawaiians | 44.1 /100 | #181 | Average $84,729 |
| Uruguayans | 43.5 /100 | #182 | Average $84,691 |
| Spaniards | 42.7 /100 | #183 | Average $84,644 |
| Immigrants | Eastern Africa | 37.4 /100 | #184 | Fair $84,299 |
| Kenyans | 34.2 /100 | #185 | Fair $84,085 |
Demographics Similar to Nigerians by Median Household Income
In terms of median household income, the demographic groups most similar to Nigerians are Immigrants from Venezuela ($81,506, a difference of 0.27%), Immigrants from Ghana ($81,489, a difference of 0.29%), White/Caucasian ($82,029, a difference of 0.37%), Ecuadorian ($82,070, a difference of 0.42%), and Yugoslavian ($82,186, a difference of 0.56%).
| Demographics | Rating | Rank | Median Household Income |
| Venezuelans | 15.3 /100 | #212 | Poor $82,432 |
| Nepalese | 15.1 /100 | #213 | Poor $82,410 |
| Panamanians | 14.0 /100 | #214 | Poor $82,272 |
| Vietnamese | 13.8 /100 | #215 | Poor $82,248 |
| Yugoslavians | 13.3 /100 | #216 | Poor $82,186 |
| Ecuadorians | 12.5 /100 | #217 | Poor $82,070 |
| Whites/Caucasians | 12.2 /100 | #218 | Poor $82,029 |
| Nigerians | 10.3 /100 | #219 | Poor $81,725 |
| Immigrants | Venezuela | 9.0 /100 | #220 | Tragic $81,506 |
| Immigrants | Ghana | 9.0 /100 | #221 | Tragic $81,489 |
| Immigrants | Nigeria | 7.7 /100 | #222 | Tragic $81,236 |
| Immigrants | El Salvador | 7.6 /100 | #223 | Tragic $81,213 |
| Malaysians | 7.0 /100 | #224 | Tragic $81,064 |
| Scotch-Irish | 6.6 /100 | #225 | Tragic $80,972 |
| Immigrants | Panama | 6.2 /100 | #226 | Tragic $80,873 |