Immigrants from North Macedonia vs Subsaharan African Median Household Income
COMPARE
Immigrants from North Macedonia
Subsaharan African
Median Household Income
Median Household Income Comparison
Immigrants from North Macedonia
Sub-Saharan Africans
$89,741
MEDIAN HOUSEHOLD INCOME
95.2/ 100
METRIC RATING
120th/ 347
METRIC RANK
$77,631
MEDIAN HOUSEHOLD INCOME
0.8/ 100
METRIC RATING
254th/ 347
METRIC RANK
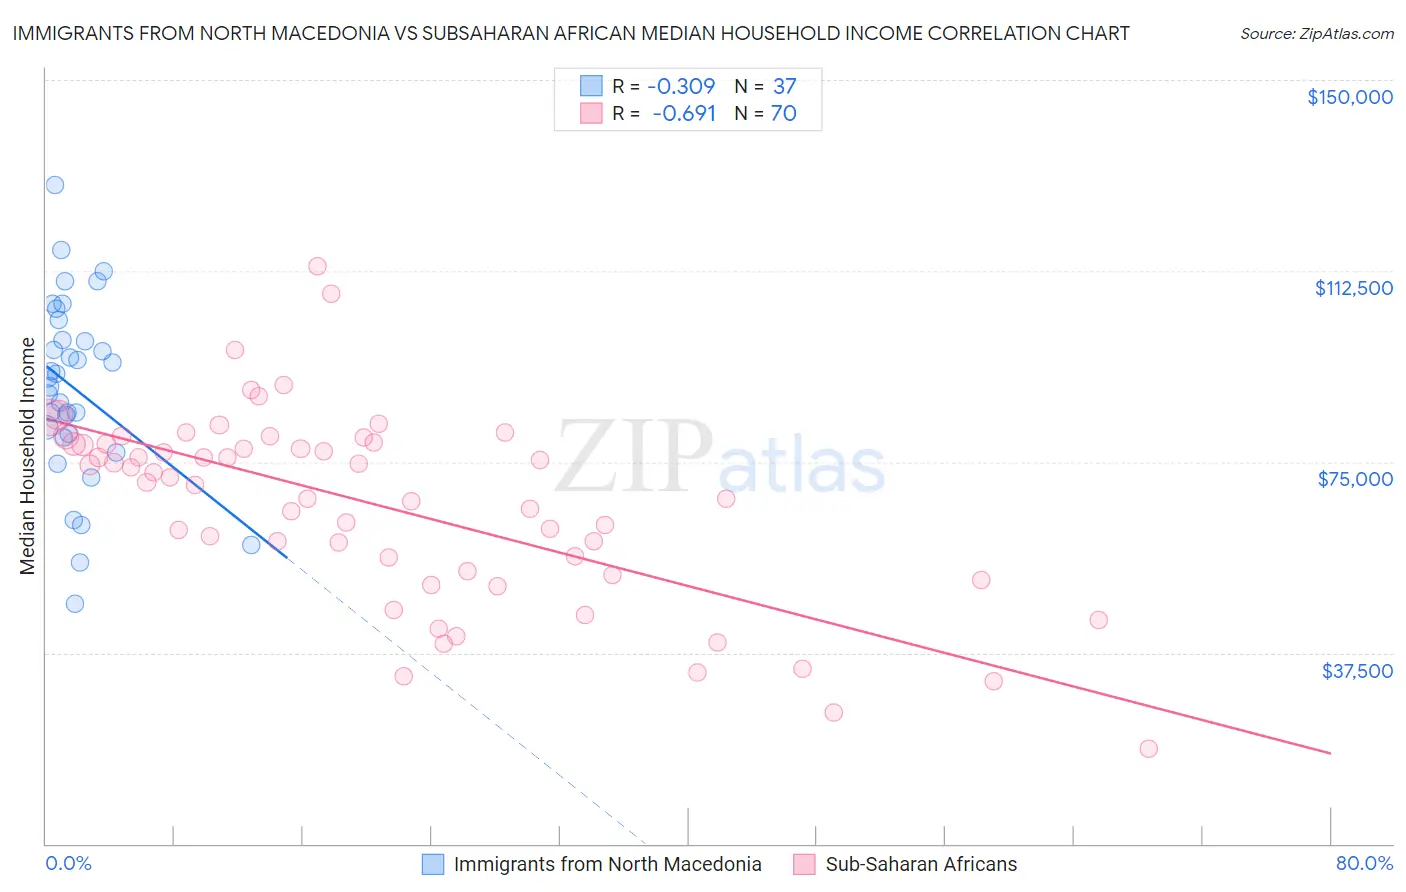
Immigrants from North Macedonia vs Subsaharan African Median Household Income Correlation Chart
The statistical analysis conducted on geographies consisting of 74,304,962 people shows a mild negative correlation between the proportion of Immigrants from North Macedonia and median household income in the United States with a correlation coefficient (R) of -0.309 and weighted average of $89,741. Similarly, the statistical analysis conducted on geographies consisting of 507,380,534 people shows a significant negative correlation between the proportion of Sub-Saharan Africans and median household income in the United States with a correlation coefficient (R) of -0.691 and weighted average of $77,631, a difference of 15.6%.
Median Household Income Correlation Summary
| Measurement | Immigrants from North Macedonia | Subsaharan African |
| Minimum | $47,094 | $18,750 |
| Maximum | $129,437 | $113,418 |
| Range | $82,343 | $94,668 |
| Mean | $89,408 | $66,483 |
| Median | $91,504 | $71,386 |
| Interquartile 25% (IQ1) | $80,151 | $53,589 |
| Interquartile 75% (IQ3) | $100,949 | $78,576 |
| Interquartile Range (IQR) | $20,798 | $24,988 |
| Standard Deviation (Sample) | $17,826 | $18,848 |
| Standard Deviation (Population) | $17,584 | $18,713 |
Similar Demographics by Median Household Income
Demographics Similar to Immigrants from North Macedonia by Median Household Income
In terms of median household income, the demographic groups most similar to Immigrants from North Macedonia are Albanian ($89,744, a difference of 0.0%), Syrian ($89,830, a difference of 0.10%), Ethiopian ($89,640, a difference of 0.11%), Pakistani ($89,638, a difference of 0.11%), and Taiwanese ($89,900, a difference of 0.18%).
| Demographics | Rating | Rank | Median Household Income |
| Peruvians | 96.5 /100 | #113 | Exceptional $90,261 |
| Immigrants | Northern Africa | 95.9 /100 | #114 | Exceptional $90,026 |
| Immigrants | Western Asia | 95.9 /100 | #115 | Exceptional $90,005 |
| Native Hawaiians | 95.7 /100 | #116 | Exceptional $89,919 |
| Taiwanese | 95.6 /100 | #117 | Exceptional $89,900 |
| Syrians | 95.4 /100 | #118 | Exceptional $89,830 |
| Albanians | 95.2 /100 | #119 | Exceptional $89,744 |
| Immigrants | North Macedonia | 95.2 /100 | #120 | Exceptional $89,741 |
| Ethiopians | 94.9 /100 | #121 | Exceptional $89,640 |
| Pakistanis | 94.8 /100 | #122 | Exceptional $89,638 |
| Immigrants | Zimbabwe | 94.4 /100 | #123 | Exceptional $89,496 |
| Immigrants | Jordan | 94.1 /100 | #124 | Exceptional $89,412 |
| Immigrants | Kuwait | 93.5 /100 | #125 | Exceptional $89,263 |
| Immigrants | Oceania | 92.9 /100 | #126 | Exceptional $89,100 |
| Immigrants | Peru | 92.5 /100 | #127 | Exceptional $89,010 |
Demographics Similar to Sub-Saharan Africans by Median Household Income
In terms of median household income, the demographic groups most similar to Sub-Saharan Africans are Immigrants from St. Vincent and the Grenadines ($77,690, a difference of 0.080%), Immigrants from Middle Africa ($77,559, a difference of 0.090%), Immigrants from West Indies ($77,956, a difference of 0.42%), Mexican American Indian ($78,166, a difference of 0.69%), and Belizean ($77,028, a difference of 0.78%).
| Demographics | Rating | Rank | Median Household Income |
| Immigrants | Burma/Myanmar | 1.6 /100 | #247 | Tragic $78,682 |
| Sudanese | 1.5 /100 | #248 | Tragic $78,529 |
| West Indians | 1.4 /100 | #249 | Tragic $78,455 |
| Immigrants | Laos | 1.3 /100 | #250 | Tragic $78,327 |
| Mexican American Indians | 1.2 /100 | #251 | Tragic $78,166 |
| Immigrants | West Indies | 1.0 /100 | #252 | Tragic $77,956 |
| Immigrants | St. Vincent and the Grenadines | 0.9 /100 | #253 | Tragic $77,690 |
| Sub-Saharan Africans | 0.8 /100 | #254 | Tragic $77,631 |
| Immigrants | Middle Africa | 0.8 /100 | #255 | Tragic $77,559 |
| Belizeans | 0.6 /100 | #256 | Tragic $77,028 |
| Immigrants | Senegal | 0.5 /100 | #257 | Tragic $76,915 |
| Immigrants | Nicaragua | 0.5 /100 | #258 | Tragic $76,784 |
| Spanish American Indians | 0.4 /100 | #259 | Tragic $76,670 |
| Jamaicans | 0.4 /100 | #260 | Tragic $76,583 |
| Immigrants | Grenada | 0.4 /100 | #261 | Tragic $76,517 |