Immigrants from Bulgaria vs Subsaharan African Median Household Income
COMPARE
Immigrants from Bulgaria
Subsaharan African
Median Household Income
Median Household Income Comparison
Immigrants from Bulgaria
Sub-Saharan Africans
$93,148
MEDIAN HOUSEHOLD INCOME
99.4/ 100
METRIC RATING
78th/ 347
METRIC RANK
$77,631
MEDIAN HOUSEHOLD INCOME
0.8/ 100
METRIC RATING
254th/ 347
METRIC RANK
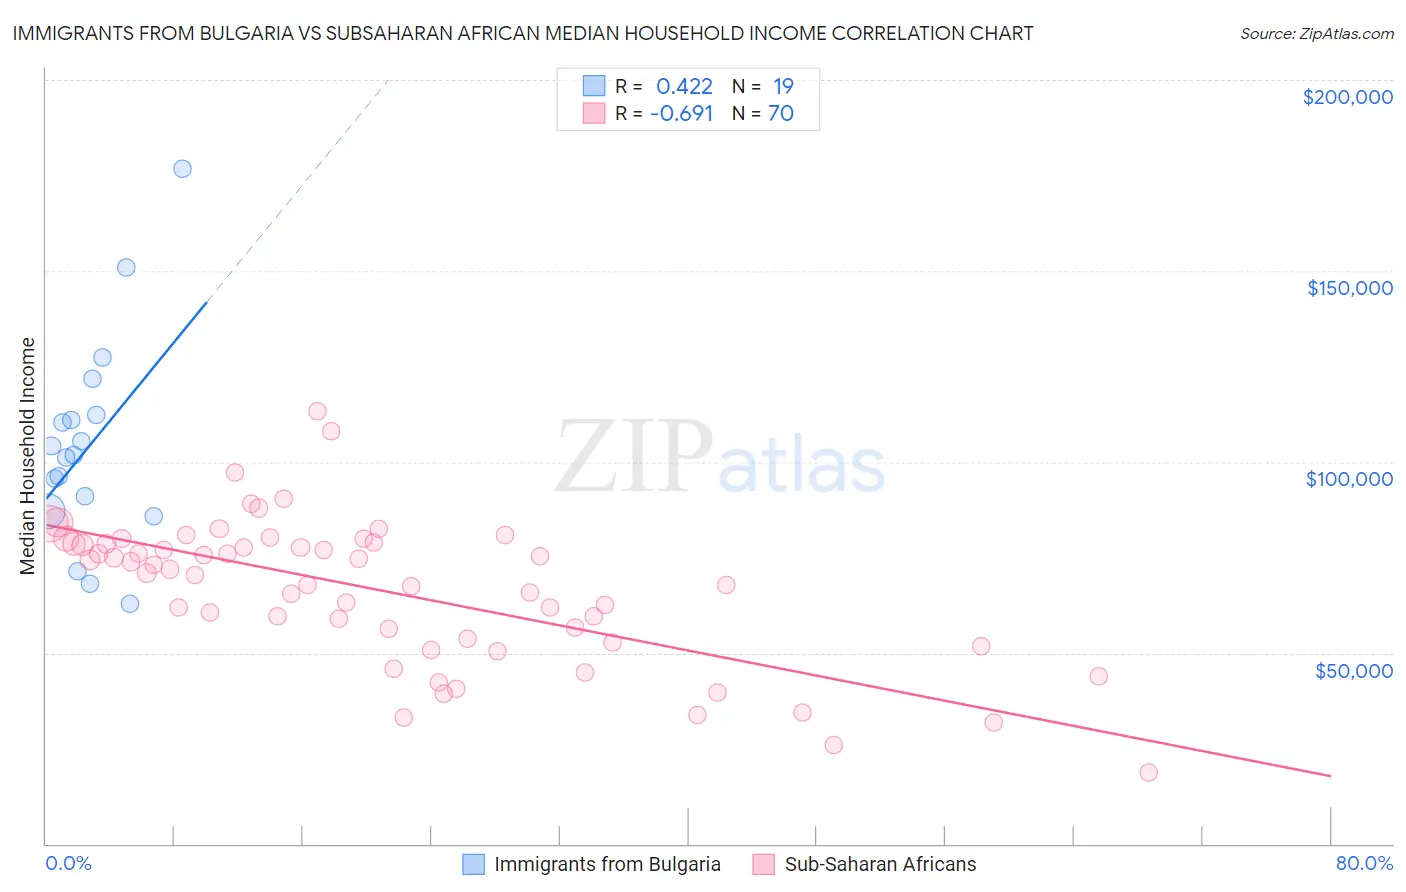
Immigrants from Bulgaria vs Subsaharan African Median Household Income Correlation Chart
The statistical analysis conducted on geographies consisting of 172,532,880 people shows a moderate positive correlation between the proportion of Immigrants from Bulgaria and median household income in the United States with a correlation coefficient (R) of 0.422 and weighted average of $93,148. Similarly, the statistical analysis conducted on geographies consisting of 507,380,534 people shows a significant negative correlation between the proportion of Sub-Saharan Africans and median household income in the United States with a correlation coefficient (R) of -0.691 and weighted average of $77,631, a difference of 20.0%.
Median Household Income Correlation Summary
| Measurement | Immigrants from Bulgaria | Subsaharan African |
| Minimum | $62,888 | $18,750 |
| Maximum | $176,736 | $113,418 |
| Range | $113,848 | $94,668 |
| Mean | $104,276 | $66,483 |
| Median | $101,764 | $71,386 |
| Interquartile 25% (IQ1) | $87,129 | $53,589 |
| Interquartile 75% (IQ3) | $112,416 | $78,576 |
| Interquartile Range (IQR) | $25,288 | $24,988 |
| Standard Deviation (Sample) | $27,381 | $18,848 |
| Standard Deviation (Population) | $26,651 | $18,713 |
Similar Demographics by Median Household Income
Demographics Similar to Immigrants from Bulgaria by Median Household Income
In terms of median household income, the demographic groups most similar to Immigrants from Bulgaria are Sri Lankan ($93,093, a difference of 0.060%), Tongan ($93,076, a difference of 0.080%), Immigrants from Eastern Europe ($93,051, a difference of 0.10%), Immigrants from Afghanistan ($93,375, a difference of 0.24%), and South African ($93,379, a difference of 0.25%).
| Demographics | Rating | Rank | Median Household Income |
| Immigrants | Philippines | 99.6 /100 | #71 | Exceptional $93,899 |
| Lithuanians | 99.6 /100 | #72 | Exceptional $93,852 |
| Immigrants | Egypt | 99.6 /100 | #73 | Exceptional $93,700 |
| Immigrants | Latvia | 99.6 /100 | #74 | Exceptional $93,602 |
| Immigrants | Italy | 99.5 /100 | #75 | Exceptional $93,465 |
| South Africans | 99.5 /100 | #76 | Exceptional $93,379 |
| Immigrants | Afghanistan | 99.5 /100 | #77 | Exceptional $93,375 |
| Immigrants | Bulgaria | 99.4 /100 | #78 | Exceptional $93,148 |
| Sri Lankans | 99.4 /100 | #79 | Exceptional $93,093 |
| Tongans | 99.4 /100 | #80 | Exceptional $93,076 |
| Immigrants | Eastern Europe | 99.4 /100 | #81 | Exceptional $93,051 |
| Immigrants | Spain | 99.3 /100 | #82 | Exceptional $92,732 |
| Italians | 99.1 /100 | #83 | Exceptional $92,475 |
| Immigrants | Argentina | 99.1 /100 | #84 | Exceptional $92,417 |
| Immigrants | Croatia | 99.0 /100 | #85 | Exceptional $92,225 |
Demographics Similar to Sub-Saharan Africans by Median Household Income
In terms of median household income, the demographic groups most similar to Sub-Saharan Africans are Immigrants from St. Vincent and the Grenadines ($77,690, a difference of 0.080%), Immigrants from Middle Africa ($77,559, a difference of 0.090%), Immigrants from West Indies ($77,956, a difference of 0.42%), Mexican American Indian ($78,166, a difference of 0.69%), and Belizean ($77,028, a difference of 0.78%).
| Demographics | Rating | Rank | Median Household Income |
| Immigrants | Burma/Myanmar | 1.6 /100 | #247 | Tragic $78,682 |
| Sudanese | 1.5 /100 | #248 | Tragic $78,529 |
| West Indians | 1.4 /100 | #249 | Tragic $78,455 |
| Immigrants | Laos | 1.3 /100 | #250 | Tragic $78,327 |
| Mexican American Indians | 1.2 /100 | #251 | Tragic $78,166 |
| Immigrants | West Indies | 1.0 /100 | #252 | Tragic $77,956 |
| Immigrants | St. Vincent and the Grenadines | 0.9 /100 | #253 | Tragic $77,690 |
| Sub-Saharan Africans | 0.8 /100 | #254 | Tragic $77,631 |
| Immigrants | Middle Africa | 0.8 /100 | #255 | Tragic $77,559 |
| Belizeans | 0.6 /100 | #256 | Tragic $77,028 |
| Immigrants | Senegal | 0.5 /100 | #257 | Tragic $76,915 |
| Immigrants | Nicaragua | 0.5 /100 | #258 | Tragic $76,784 |
| Spanish American Indians | 0.4 /100 | #259 | Tragic $76,670 |
| Jamaicans | 0.4 /100 | #260 | Tragic $76,583 |
| Immigrants | Grenada | 0.4 /100 | #261 | Tragic $76,517 |