Mexican American Indian vs Subsaharan African Median Household Income
COMPARE
Mexican American Indian
Subsaharan African
Median Household Income
Median Household Income Comparison
Mexican American Indians
Sub-Saharan Africans
$78,166
MEDIAN HOUSEHOLD INCOME
1.2/ 100
METRIC RATING
251st/ 347
METRIC RANK
$77,631
MEDIAN HOUSEHOLD INCOME
0.8/ 100
METRIC RATING
254th/ 347
METRIC RANK
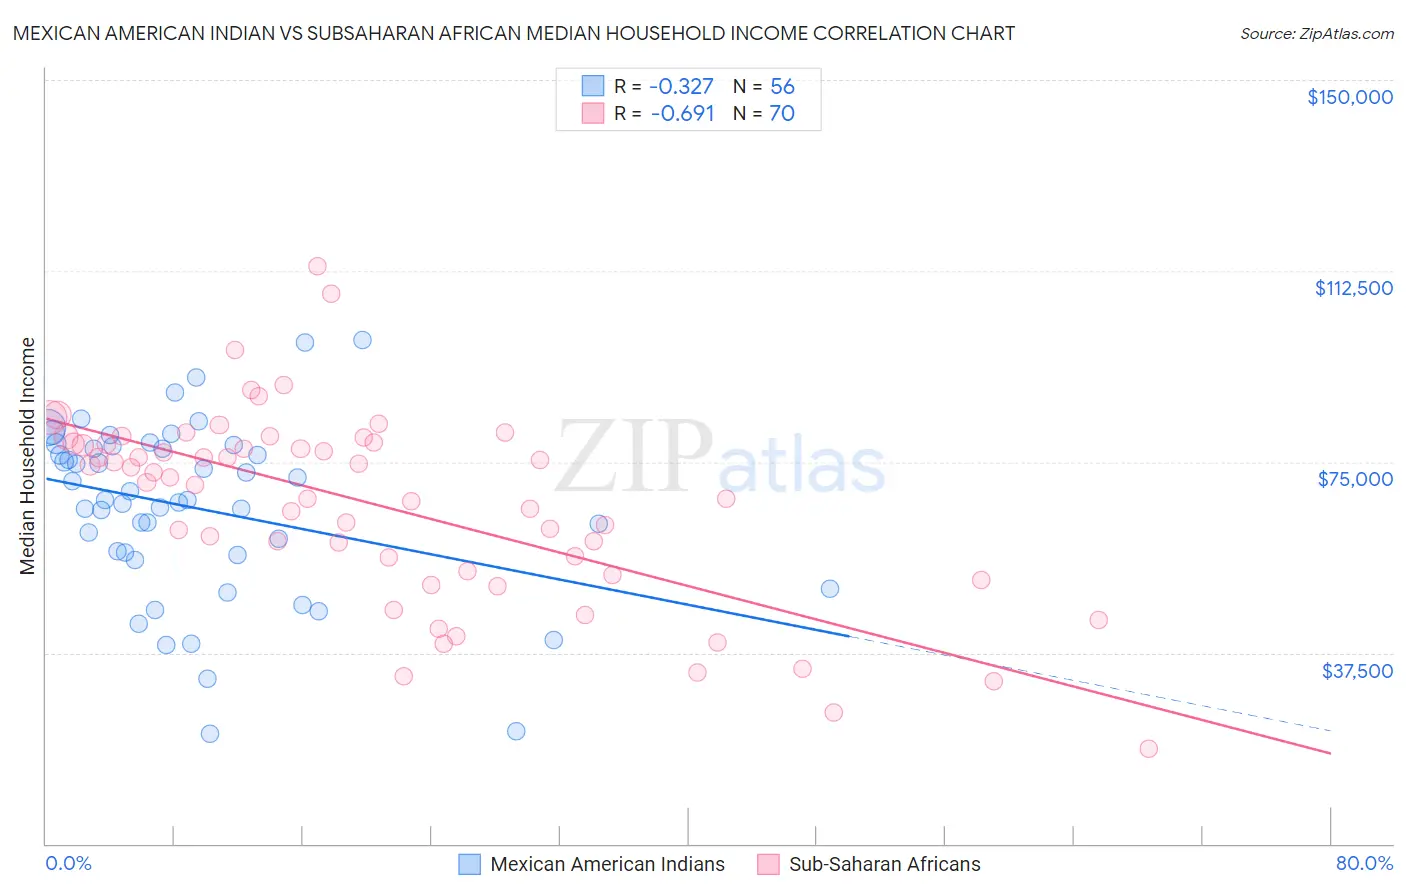
Mexican American Indian vs Subsaharan African Median Household Income Correlation Chart
The statistical analysis conducted on geographies consisting of 317,474,541 people shows a mild negative correlation between the proportion of Mexican American Indians and median household income in the United States with a correlation coefficient (R) of -0.327 and weighted average of $78,166. Similarly, the statistical analysis conducted on geographies consisting of 507,380,534 people shows a significant negative correlation between the proportion of Sub-Saharan Africans and median household income in the United States with a correlation coefficient (R) of -0.691 and weighted average of $77,631, a difference of 0.69%.
Median Household Income Correlation Summary
| Measurement | Mexican American Indian | Subsaharan African |
| Minimum | $21,567 | $18,750 |
| Maximum | $98,902 | $113,418 |
| Range | $77,335 | $94,668 |
| Mean | $65,927 | $66,483 |
| Median | $67,552 | $71,386 |
| Interquartile 25% (IQ1) | $56,868 | $53,589 |
| Interquartile 75% (IQ3) | $77,810 | $78,576 |
| Interquartile Range (IQR) | $20,942 | $24,988 |
| Standard Deviation (Sample) | $17,155 | $18,848 |
| Standard Deviation (Population) | $17,001 | $18,713 |
Demographics Similar to Mexican American Indians and Sub-Saharan Africans by Median Household Income
In terms of median household income, the demographic groups most similar to Mexican American Indians are Immigrants from Laos ($78,327, a difference of 0.21%), Immigrants from West Indies ($77,956, a difference of 0.27%), West Indian ($78,455, a difference of 0.37%), Sudanese ($78,529, a difference of 0.46%), and Immigrants from St. Vincent and the Grenadines ($77,690, a difference of 0.61%). Similarly, the demographic groups most similar to Sub-Saharan Africans are Immigrants from St. Vincent and the Grenadines ($77,690, a difference of 0.080%), Immigrants from Middle Africa ($77,559, a difference of 0.090%), Immigrants from West Indies ($77,956, a difference of 0.42%), Belizean ($77,028, a difference of 0.78%), and Immigrants from Laos ($78,327, a difference of 0.90%).
| Demographics | Rating | Rank | Median Household Income |
| Immigrants | Sudan | 2.1 /100 | #242 | Tragic $79,103 |
| Immigrants | Barbados | 1.9 /100 | #243 | Tragic $78,989 |
| Marshallese | 1.9 /100 | #244 | Tragic $78,930 |
| Inupiat | 1.8 /100 | #245 | Tragic $78,841 |
| Central Americans | 1.7 /100 | #246 | Tragic $78,803 |
| Immigrants | Burma/Myanmar | 1.6 /100 | #247 | Tragic $78,682 |
| Sudanese | 1.5 /100 | #248 | Tragic $78,529 |
| West Indians | 1.4 /100 | #249 | Tragic $78,455 |
| Immigrants | Laos | 1.3 /100 | #250 | Tragic $78,327 |
| Mexican American Indians | 1.2 /100 | #251 | Tragic $78,166 |
| Immigrants | West Indies | 1.0 /100 | #252 | Tragic $77,956 |
| Immigrants | St. Vincent and the Grenadines | 0.9 /100 | #253 | Tragic $77,690 |
| Sub-Saharan Africans | 0.8 /100 | #254 | Tragic $77,631 |
| Immigrants | Middle Africa | 0.8 /100 | #255 | Tragic $77,559 |
| Belizeans | 0.6 /100 | #256 | Tragic $77,028 |
| Immigrants | Senegal | 0.5 /100 | #257 | Tragic $76,915 |
| Immigrants | Nicaragua | 0.5 /100 | #258 | Tragic $76,784 |
| Spanish American Indians | 0.4 /100 | #259 | Tragic $76,670 |
| Jamaicans | 0.4 /100 | #260 | Tragic $76,583 |
| Immigrants | Grenada | 0.4 /100 | #261 | Tragic $76,517 |
| French American Indians | 0.4 /100 | #262 | Tragic $76,387 |