Czechoslovakian vs Carpatho Rusyn Median Household Income
COMPARE
Czechoslovakian
Carpatho Rusyn
Median Household Income
Median Household Income Comparison
Czechoslovakians
Carpatho Rusyns
$84,965
MEDIAN HOUSEHOLD INCOME
47.8/ 100
METRIC RATING
178th/ 347
METRIC RANK
$86,635
MEDIAN HOUSEHOLD INCOME
72.8/ 100
METRIC RATING
155th/ 347
METRIC RANK
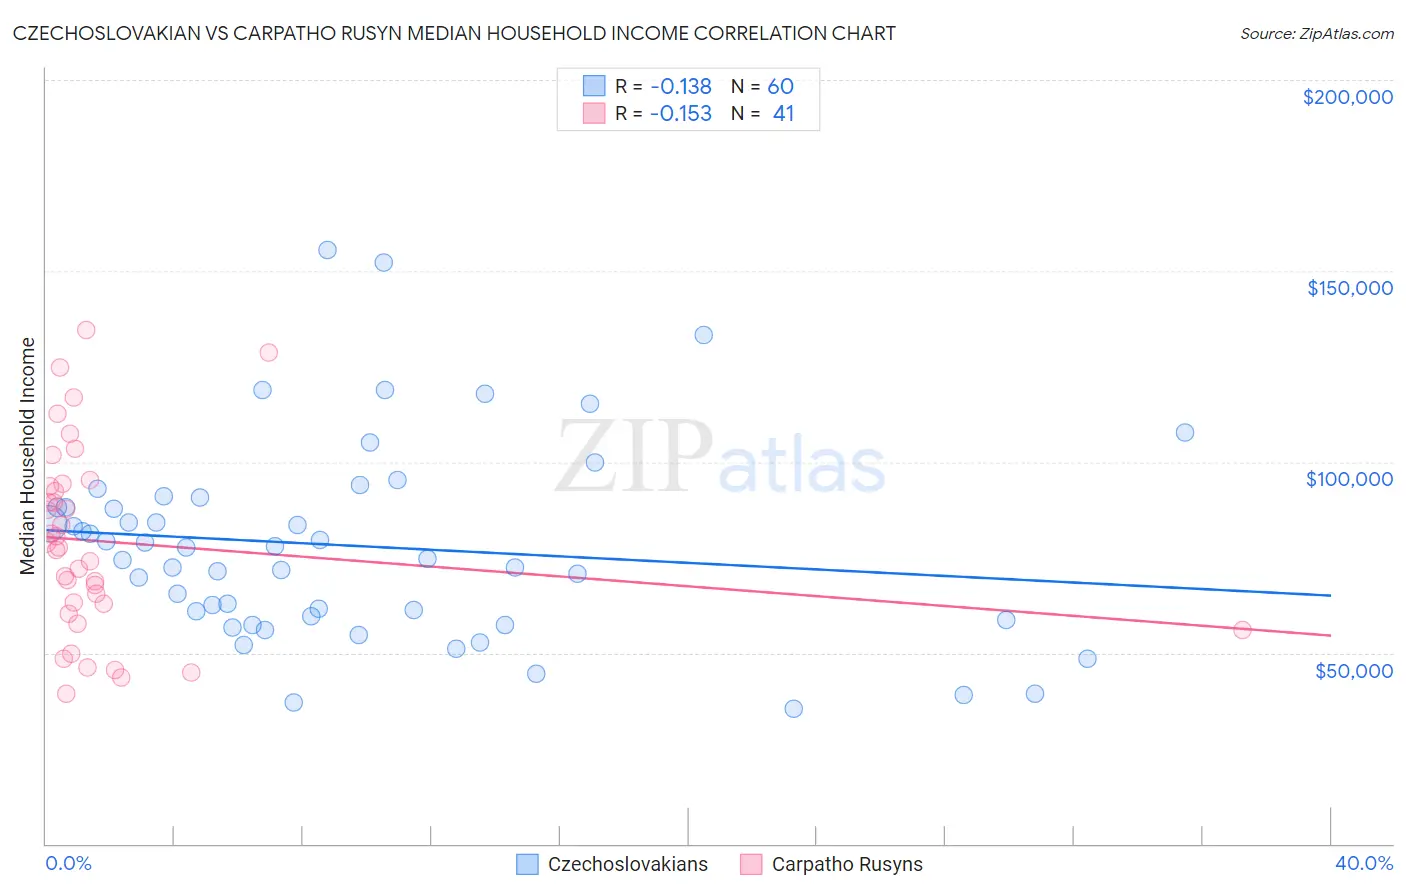
Czechoslovakian vs Carpatho Rusyn Median Household Income Correlation Chart
The statistical analysis conducted on geographies consisting of 368,473,547 people shows a poor negative correlation between the proportion of Czechoslovakians and median household income in the United States with a correlation coefficient (R) of -0.138 and weighted average of $84,965. Similarly, the statistical analysis conducted on geographies consisting of 58,866,106 people shows a poor negative correlation between the proportion of Carpatho Rusyns and median household income in the United States with a correlation coefficient (R) of -0.153 and weighted average of $86,635, a difference of 2.0%.
Median Household Income Correlation Summary
| Measurement | Czechoslovakian | Carpatho Rusyn |
| Minimum | $35,250 | $39,318 |
| Maximum | $155,633 | $134,440 |
| Range | $120,383 | $95,122 |
| Mean | $77,955 | $79,082 |
| Median | $76,068 | $77,705 |
| Interquartile 25% (IQ1) | $59,148 | $61,521 |
| Interquartile 75% (IQ3) | $89,491 | $93,841 |
| Interquartile Range (IQR) | $30,343 | $32,321 |
| Standard Deviation (Sample) | $26,040 | $24,465 |
| Standard Deviation (Population) | $25,822 | $24,165 |
Similar Demographics by Median Household Income
Demographics Similar to Czechoslovakians by Median Household Income
In terms of median household income, the demographic groups most similar to Czechoslovakians are English ($84,915, a difference of 0.060%), Immigrants from Eritrea ($85,025, a difference of 0.070%), Immigrants from Costa Rica ($85,054, a difference of 0.10%), Alsatian ($85,053, a difference of 0.10%), and Scottish ($85,101, a difference of 0.16%).
| Demographics | Rating | Rank | Median Household Income |
| Immigrants | South America | 58.1 /100 | #171 | Average $85,611 |
| Slovenes | 57.4 /100 | #172 | Average $85,562 |
| Immigrants | Cameroon | 53.4 /100 | #173 | Average $85,314 |
| Scottish | 50.0 /100 | #174 | Average $85,101 |
| Immigrants | Costa Rica | 49.2 /100 | #175 | Average $85,054 |
| Alsatians | 49.2 /100 | #176 | Average $85,053 |
| Immigrants | Eritrea | 48.8 /100 | #177 | Average $85,025 |
| Czechoslovakians | 47.8 /100 | #178 | Average $84,965 |
| English | 47.0 /100 | #179 | Average $84,915 |
| Immigrants | Portugal | 44.2 /100 | #180 | Average $84,740 |
| Hawaiians | 44.1 /100 | #181 | Average $84,729 |
| Uruguayans | 43.5 /100 | #182 | Average $84,691 |
| Spaniards | 42.7 /100 | #183 | Average $84,644 |
| Immigrants | Eastern Africa | 37.4 /100 | #184 | Fair $84,299 |
| Kenyans | 34.2 /100 | #185 | Fair $84,085 |
Demographics Similar to Carpatho Rusyns by Median Household Income
In terms of median household income, the demographic groups most similar to Carpatho Rusyns are Immigrants from Albania ($86,534, a difference of 0.12%), Immigrants from Germany ($86,764, a difference of 0.15%), Samoan ($86,498, a difference of 0.16%), Moroccan ($86,468, a difference of 0.19%), and South American ($86,824, a difference of 0.22%).
| Demographics | Rating | Rank | Median Household Income |
| Costa Ricans | 80.0 /100 | #148 | Excellent $87,262 |
| Immigrants | Nepal | 77.7 /100 | #149 | Good $87,046 |
| Basques | 77.2 /100 | #150 | Good $87,001 |
| Hungarians | 76.3 /100 | #151 | Good $86,920 |
| Immigrants | Saudi Arabia | 75.8 /100 | #152 | Good $86,875 |
| South Americans | 75.1 /100 | #153 | Good $86,824 |
| Immigrants | Germany | 74.4 /100 | #154 | Good $86,764 |
| Carpatho Rusyns | 72.8 /100 | #155 | Good $86,635 |
| Immigrants | Albania | 71.5 /100 | #156 | Good $86,534 |
| Samoans | 71.0 /100 | #157 | Good $86,498 |
| Moroccans | 70.6 /100 | #158 | Good $86,468 |
| Immigrants | Uzbekistan | 70.1 /100 | #159 | Good $86,425 |
| Luxembourgers | 70.0 /100 | #160 | Good $86,418 |
| Slavs | 69.7 /100 | #161 | Good $86,398 |
| Guamanians/Chamorros | 67.7 /100 | #162 | Good $86,255 |