Czechoslovakian vs Senegalese Median Household Income
COMPARE
Czechoslovakian
Senegalese
Median Household Income
Median Household Income Comparison
Czechoslovakians
Senegalese
$84,965
MEDIAN HOUSEHOLD INCOME
47.8/ 100
METRIC RATING
178th/ 347
METRIC RANK
$74,999
MEDIAN HOUSEHOLD INCOME
0.2/ 100
METRIC RATING
280th/ 347
METRIC RANK
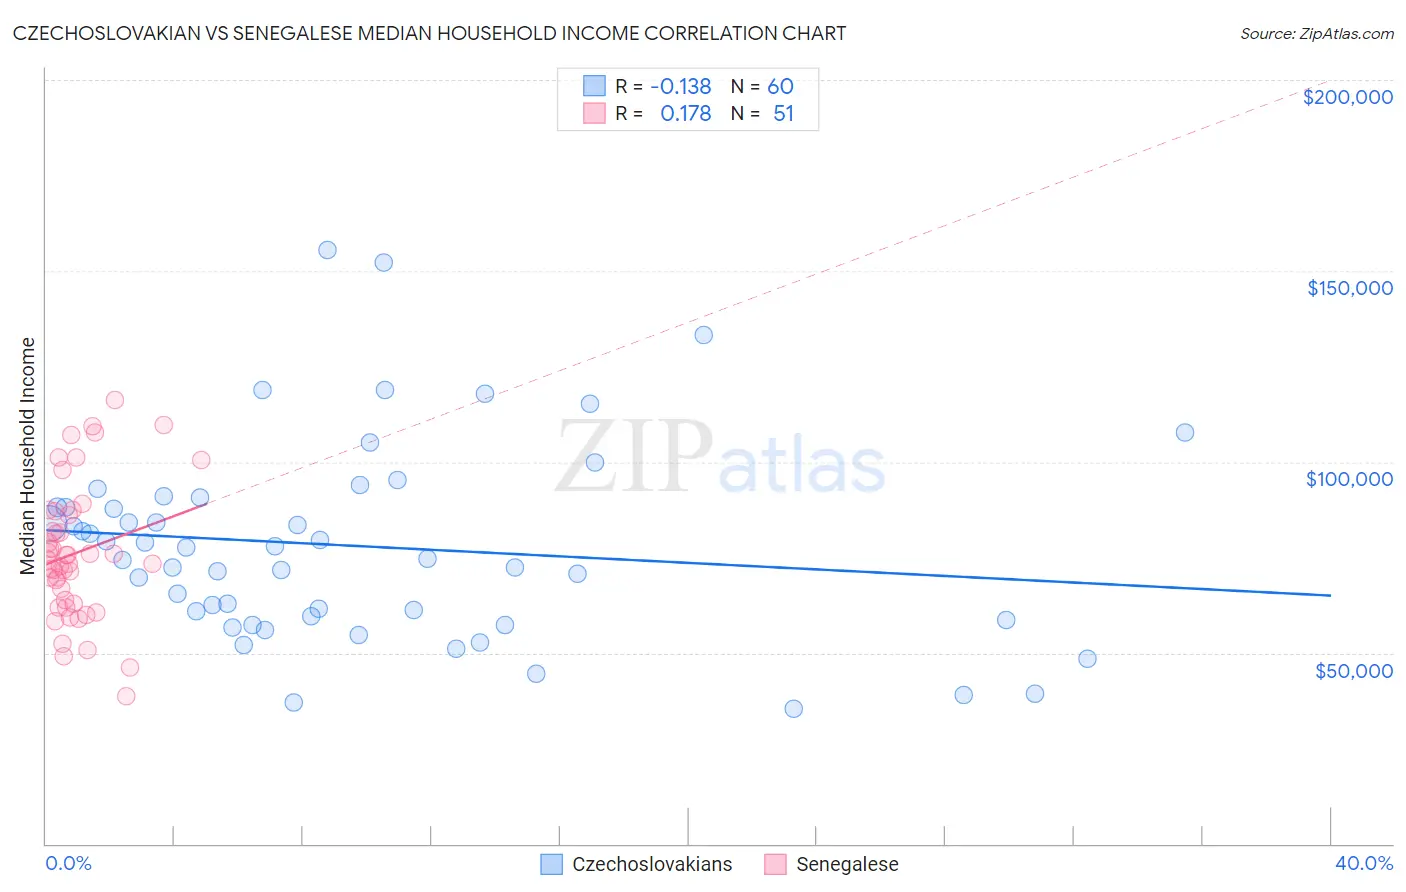
Czechoslovakian vs Senegalese Median Household Income Correlation Chart
The statistical analysis conducted on geographies consisting of 368,473,547 people shows a poor negative correlation between the proportion of Czechoslovakians and median household income in the United States with a correlation coefficient (R) of -0.138 and weighted average of $84,965. Similarly, the statistical analysis conducted on geographies consisting of 78,073,894 people shows a poor positive correlation between the proportion of Senegalese and median household income in the United States with a correlation coefficient (R) of 0.178 and weighted average of $74,999, a difference of 13.3%.
Median Household Income Correlation Summary
| Measurement | Czechoslovakian | Senegalese |
| Minimum | $35,250 | $38,686 |
| Maximum | $155,633 | $116,116 |
| Range | $120,383 | $77,430 |
| Mean | $77,955 | $76,167 |
| Median | $76,068 | $74,286 |
| Interquartile 25% (IQ1) | $59,148 | $62,685 |
| Interquartile 75% (IQ3) | $89,491 | $87,125 |
| Interquartile Range (IQR) | $30,343 | $24,440 |
| Standard Deviation (Sample) | $26,040 | $17,624 |
| Standard Deviation (Population) | $25,822 | $17,451 |
Similar Demographics by Median Household Income
Demographics Similar to Czechoslovakians by Median Household Income
In terms of median household income, the demographic groups most similar to Czechoslovakians are English ($84,915, a difference of 0.060%), Immigrants from Eritrea ($85,025, a difference of 0.070%), Immigrants from Costa Rica ($85,054, a difference of 0.10%), Alsatian ($85,053, a difference of 0.10%), and Scottish ($85,101, a difference of 0.16%).
| Demographics | Rating | Rank | Median Household Income |
| Immigrants | South America | 58.1 /100 | #171 | Average $85,611 |
| Slovenes | 57.4 /100 | #172 | Average $85,562 |
| Immigrants | Cameroon | 53.4 /100 | #173 | Average $85,314 |
| Scottish | 50.0 /100 | #174 | Average $85,101 |
| Immigrants | Costa Rica | 49.2 /100 | #175 | Average $85,054 |
| Alsatians | 49.2 /100 | #176 | Average $85,053 |
| Immigrants | Eritrea | 48.8 /100 | #177 | Average $85,025 |
| Czechoslovakians | 47.8 /100 | #178 | Average $84,965 |
| English | 47.0 /100 | #179 | Average $84,915 |
| Immigrants | Portugal | 44.2 /100 | #180 | Average $84,740 |
| Hawaiians | 44.1 /100 | #181 | Average $84,729 |
| Uruguayans | 43.5 /100 | #182 | Average $84,691 |
| Spaniards | 42.7 /100 | #183 | Average $84,644 |
| Immigrants | Eastern Africa | 37.4 /100 | #184 | Fair $84,299 |
| Kenyans | 34.2 /100 | #185 | Fair $84,085 |
Demographics Similar to Senegalese by Median Household Income
In terms of median household income, the demographic groups most similar to Senegalese are Immigrants from Liberia ($74,896, a difference of 0.14%), Immigrants from Guatemala ($75,123, a difference of 0.16%), Central American Indian ($74,847, a difference of 0.20%), Osage ($75,240, a difference of 0.32%), and Cree ($74,685, a difference of 0.42%).
| Demographics | Rating | Rank | Median Household Income |
| Liberians | 0.2 /100 | #273 | Tragic $75,667 |
| British West Indians | 0.2 /100 | #274 | Tragic $75,647 |
| Immigrants | Micronesia | 0.2 /100 | #275 | Tragic $75,574 |
| Immigrants | Latin America | 0.2 /100 | #276 | Tragic $75,420 |
| Spanish Americans | 0.2 /100 | #277 | Tragic $75,386 |
| Osage | 0.2 /100 | #278 | Tragic $75,240 |
| Immigrants | Guatemala | 0.2 /100 | #279 | Tragic $75,123 |
| Senegalese | 0.2 /100 | #280 | Tragic $74,999 |
| Immigrants | Liberia | 0.1 /100 | #281 | Tragic $74,896 |
| Central American Indians | 0.1 /100 | #282 | Tragic $74,847 |
| Cree | 0.1 /100 | #283 | Tragic $74,685 |
| Yaqui | 0.1 /100 | #284 | Tragic $74,596 |
| Mexicans | 0.1 /100 | #285 | Tragic $74,399 |
| Immigrants | Somalia | 0.1 /100 | #286 | Tragic $74,300 |
| Iroquois | 0.1 /100 | #287 | Tragic $74,279 |