Puerto Rican vs Subsaharan African Median Household Income
COMPARE
Puerto Rican
Subsaharan African
Median Household Income
Median Household Income Comparison
Puerto Ricans
Sub-Saharan Africans
$59,197
MEDIAN HOUSEHOLD INCOME
0.0/ 100
METRIC RATING
345th/ 347
METRIC RANK
$77,631
MEDIAN HOUSEHOLD INCOME
0.8/ 100
METRIC RATING
254th/ 347
METRIC RANK
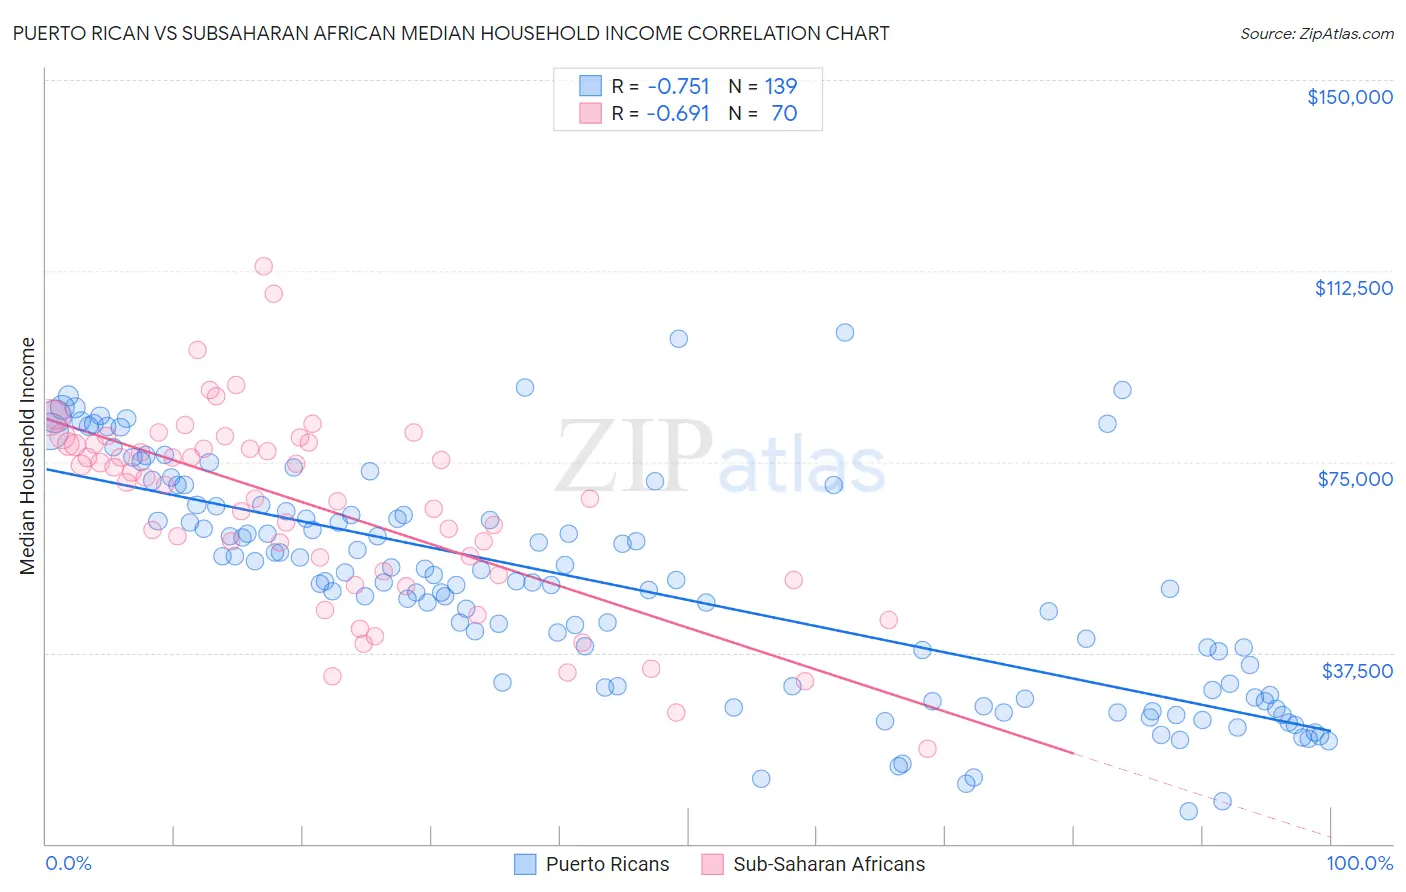
Puerto Rican vs Subsaharan African Median Household Income Correlation Chart
The statistical analysis conducted on geographies consisting of 527,459,436 people shows a strong negative correlation between the proportion of Puerto Ricans and median household income in the United States with a correlation coefficient (R) of -0.751 and weighted average of $59,197. Similarly, the statistical analysis conducted on geographies consisting of 507,380,534 people shows a significant negative correlation between the proportion of Sub-Saharan Africans and median household income in the United States with a correlation coefficient (R) of -0.691 and weighted average of $77,631, a difference of 31.1%.
Median Household Income Correlation Summary
| Measurement | Puerto Rican | Subsaharan African |
| Minimum | $6,449 | $18,750 |
| Maximum | $100,425 | $113,418 |
| Range | $93,976 | $94,668 |
| Mean | $50,898 | $66,483 |
| Median | $51,527 | $71,386 |
| Interquartile 25% (IQ1) | $30,679 | $53,589 |
| Interquartile 75% (IQ3) | $65,376 | $78,576 |
| Interquartile Range (IQR) | $34,697 | $24,988 |
| Standard Deviation (Sample) | $21,767 | $18,848 |
| Standard Deviation (Population) | $21,689 | $18,713 |
Similar Demographics by Median Household Income
Demographics Similar to Puerto Ricans by Median Household Income
In terms of median household income, the demographic groups most similar to Puerto Ricans are Navajo ($59,159, a difference of 0.060%), Tohono O'odham ($61,663, a difference of 4.2%), Houma ($62,575, a difference of 5.7%), Pima ($63,262, a difference of 6.9%), and Crow ($63,681, a difference of 7.6%).
| Demographics | Rating | Rank | Median Household Income |
| Creek | 0.0 /100 | #333 | Tragic $67,715 |
| Blacks/African Americans | 0.0 /100 | #334 | Tragic $67,573 |
| Cheyenne | 0.0 /100 | #335 | Tragic $66,974 |
| Immigrants | Congo | 0.0 /100 | #336 | Tragic $66,768 |
| Kiowa | 0.0 /100 | #337 | Tragic $65,914 |
| Immigrants | Yemen | 0.0 /100 | #338 | Tragic $65,194 |
| Hopi | 0.0 /100 | #339 | Tragic $65,043 |
| Pueblo | 0.0 /100 | #340 | Tragic $64,692 |
| Crow | 0.0 /100 | #341 | Tragic $63,681 |
| Pima | 0.0 /100 | #342 | Tragic $63,262 |
| Houma | 0.0 /100 | #343 | Tragic $62,575 |
| Tohono O'odham | 0.0 /100 | #344 | Tragic $61,663 |
| Puerto Ricans | 0.0 /100 | #345 | Tragic $59,197 |
| Navajo | 0.0 /100 | #346 | Tragic $59,159 |
| Lumbee | 0.0 /100 | #347 | Tragic $54,644 |
Demographics Similar to Sub-Saharan Africans by Median Household Income
In terms of median household income, the demographic groups most similar to Sub-Saharan Africans are Immigrants from St. Vincent and the Grenadines ($77,690, a difference of 0.080%), Immigrants from Middle Africa ($77,559, a difference of 0.090%), Immigrants from West Indies ($77,956, a difference of 0.42%), Mexican American Indian ($78,166, a difference of 0.69%), and Belizean ($77,028, a difference of 0.78%).
| Demographics | Rating | Rank | Median Household Income |
| Immigrants | Burma/Myanmar | 1.6 /100 | #247 | Tragic $78,682 |
| Sudanese | 1.5 /100 | #248 | Tragic $78,529 |
| West Indians | 1.4 /100 | #249 | Tragic $78,455 |
| Immigrants | Laos | 1.3 /100 | #250 | Tragic $78,327 |
| Mexican American Indians | 1.2 /100 | #251 | Tragic $78,166 |
| Immigrants | West Indies | 1.0 /100 | #252 | Tragic $77,956 |
| Immigrants | St. Vincent and the Grenadines | 0.9 /100 | #253 | Tragic $77,690 |
| Sub-Saharan Africans | 0.8 /100 | #254 | Tragic $77,631 |
| Immigrants | Middle Africa | 0.8 /100 | #255 | Tragic $77,559 |
| Belizeans | 0.6 /100 | #256 | Tragic $77,028 |
| Immigrants | Senegal | 0.5 /100 | #257 | Tragic $76,915 |
| Immigrants | Nicaragua | 0.5 /100 | #258 | Tragic $76,784 |
| Spanish American Indians | 0.4 /100 | #259 | Tragic $76,670 |
| Jamaicans | 0.4 /100 | #260 | Tragic $76,583 |
| Immigrants | Grenada | 0.4 /100 | #261 | Tragic $76,517 |