Czechoslovakian vs Immigrants from Zaire Median Household Income
COMPARE
Czechoslovakian
Immigrants from Zaire
Median Household Income
Median Household Income Comparison
Czechoslovakians
Immigrants from Zaire
$84,965
MEDIAN HOUSEHOLD INCOME
47.8/ 100
METRIC RATING
178th/ 347
METRIC RANK
$71,801
MEDIAN HOUSEHOLD INCOME
0.0/ 100
METRIC RATING
311th/ 347
METRIC RANK
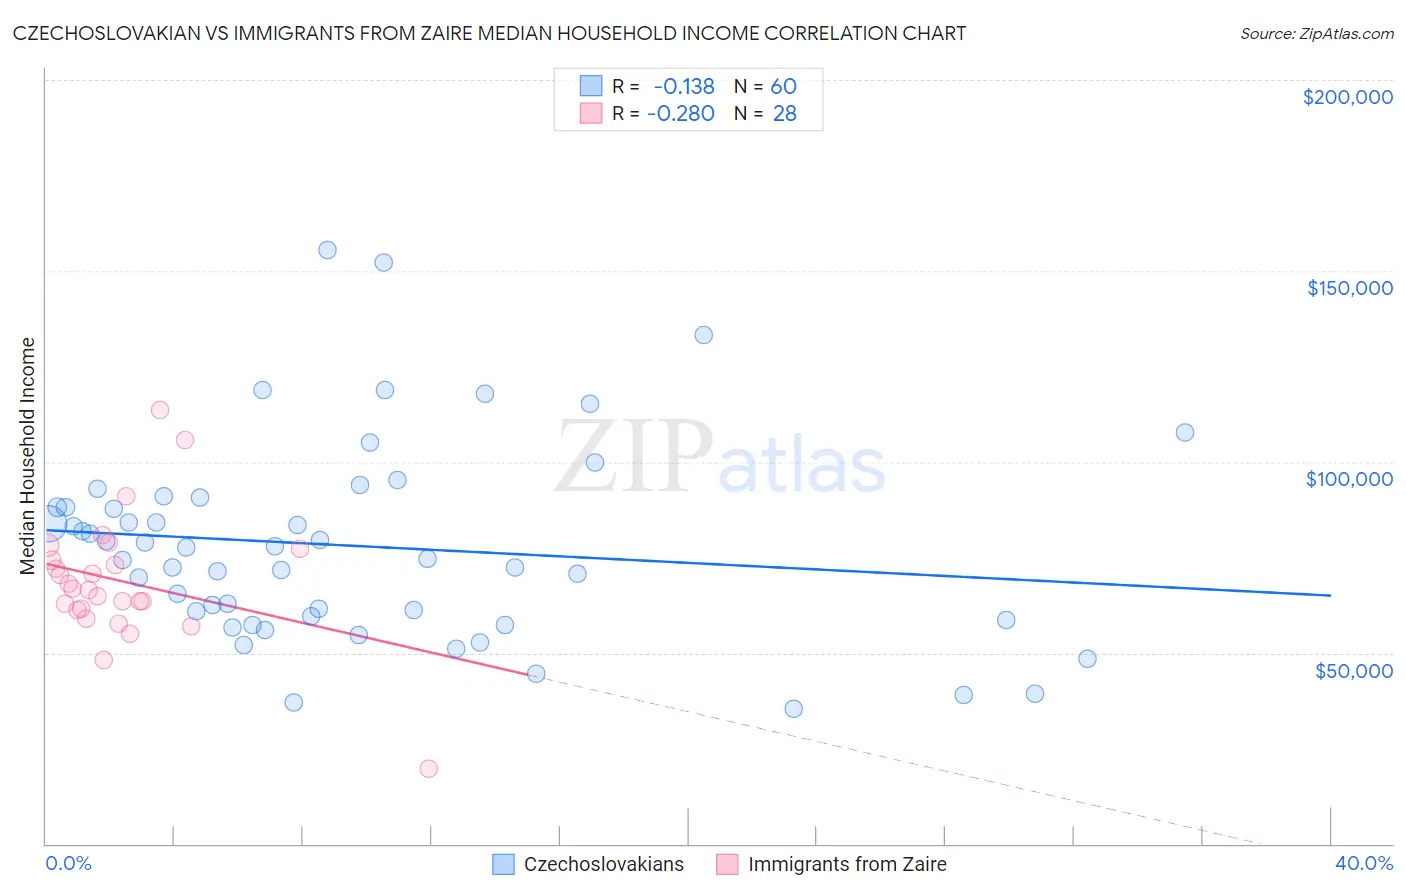
Czechoslovakian vs Immigrants from Zaire Median Household Income Correlation Chart
The statistical analysis conducted on geographies consisting of 368,473,547 people shows a poor negative correlation between the proportion of Czechoslovakians and median household income in the United States with a correlation coefficient (R) of -0.138 and weighted average of $84,965. Similarly, the statistical analysis conducted on geographies consisting of 107,241,682 people shows a weak negative correlation between the proportion of Immigrants from Zaire and median household income in the United States with a correlation coefficient (R) of -0.280 and weighted average of $71,801, a difference of 18.3%.
Median Household Income Correlation Summary
| Measurement | Czechoslovakian | Immigrants from Zaire |
| Minimum | $35,250 | $19,722 |
| Maximum | $155,633 | $113,664 |
| Range | $120,383 | $93,942 |
| Mean | $77,955 | $68,739 |
| Median | $76,068 | $66,729 |
| Interquartile 25% (IQ1) | $59,148 | $61,417 |
| Interquartile 75% (IQ3) | $89,491 | $75,692 |
| Interquartile Range (IQR) | $30,343 | $14,275 |
| Standard Deviation (Sample) | $26,040 | $17,188 |
| Standard Deviation (Population) | $25,822 | $16,878 |
Similar Demographics by Median Household Income
Demographics Similar to Czechoslovakians by Median Household Income
In terms of median household income, the demographic groups most similar to Czechoslovakians are English ($84,915, a difference of 0.060%), Immigrants from Eritrea ($85,025, a difference of 0.070%), Immigrants from Costa Rica ($85,054, a difference of 0.10%), Alsatian ($85,053, a difference of 0.10%), and Scottish ($85,101, a difference of 0.16%).
| Demographics | Rating | Rank | Median Household Income |
| Immigrants | South America | 58.1 /100 | #171 | Average $85,611 |
| Slovenes | 57.4 /100 | #172 | Average $85,562 |
| Immigrants | Cameroon | 53.4 /100 | #173 | Average $85,314 |
| Scottish | 50.0 /100 | #174 | Average $85,101 |
| Immigrants | Costa Rica | 49.2 /100 | #175 | Average $85,054 |
| Alsatians | 49.2 /100 | #176 | Average $85,053 |
| Immigrants | Eritrea | 48.8 /100 | #177 | Average $85,025 |
| Czechoslovakians | 47.8 /100 | #178 | Average $84,965 |
| English | 47.0 /100 | #179 | Average $84,915 |
| Immigrants | Portugal | 44.2 /100 | #180 | Average $84,740 |
| Hawaiians | 44.1 /100 | #181 | Average $84,729 |
| Uruguayans | 43.5 /100 | #182 | Average $84,691 |
| Spaniards | 42.7 /100 | #183 | Average $84,644 |
| Immigrants | Eastern Africa | 37.4 /100 | #184 | Fair $84,299 |
| Kenyans | 34.2 /100 | #185 | Fair $84,085 |
Demographics Similar to Immigrants from Zaire by Median Household Income
In terms of median household income, the demographic groups most similar to Immigrants from Zaire are U.S. Virgin Islander ($71,853, a difference of 0.070%), Immigrants from Caribbean ($71,860, a difference of 0.080%), Immigrants from Honduras ($71,452, a difference of 0.49%), Yakama ($72,225, a difference of 0.59%), and Immigrants from Bahamas ($71,349, a difference of 0.63%).
| Demographics | Rating | Rank | Median Household Income |
| Immigrants | Haiti | 0.0 /100 | #304 | Tragic $72,599 |
| Hondurans | 0.0 /100 | #305 | Tragic $72,588 |
| Potawatomi | 0.0 /100 | #306 | Tragic $72,576 |
| Ute | 0.0 /100 | #307 | Tragic $72,402 |
| Yakama | 0.0 /100 | #308 | Tragic $72,225 |
| Immigrants | Caribbean | 0.0 /100 | #309 | Tragic $71,860 |
| U.S. Virgin Islanders | 0.0 /100 | #310 | Tragic $71,853 |
| Immigrants | Zaire | 0.0 /100 | #311 | Tragic $71,801 |
| Immigrants | Honduras | 0.0 /100 | #312 | Tragic $71,452 |
| Immigrants | Bahamas | 0.0 /100 | #313 | Tragic $71,349 |
| Dominicans | 0.0 /100 | #314 | Tragic $71,302 |
| Ottawa | 0.0 /100 | #315 | Tragic $70,984 |
| Apache | 0.0 /100 | #316 | Tragic $70,927 |
| Cajuns | 0.0 /100 | #317 | Tragic $70,605 |
| Chippewa | 0.0 /100 | #318 | Tragic $70,539 |