Albanian vs Immigrants from Dominican Republic Wage/Income Gap
COMPARE
Albanian
Immigrants from Dominican Republic
Wage/Income Gap
Wage/Income Gap Comparison
Albanians
Immigrants from Dominican Republic
25.4%
WAGE/INCOME GAP
69.4/ 100
METRIC RATING
161st/ 347
METRIC RANK
20.6%
WAGE/INCOME GAP
100.0/ 100
METRIC RATING
23rd/ 347
METRIC RANK
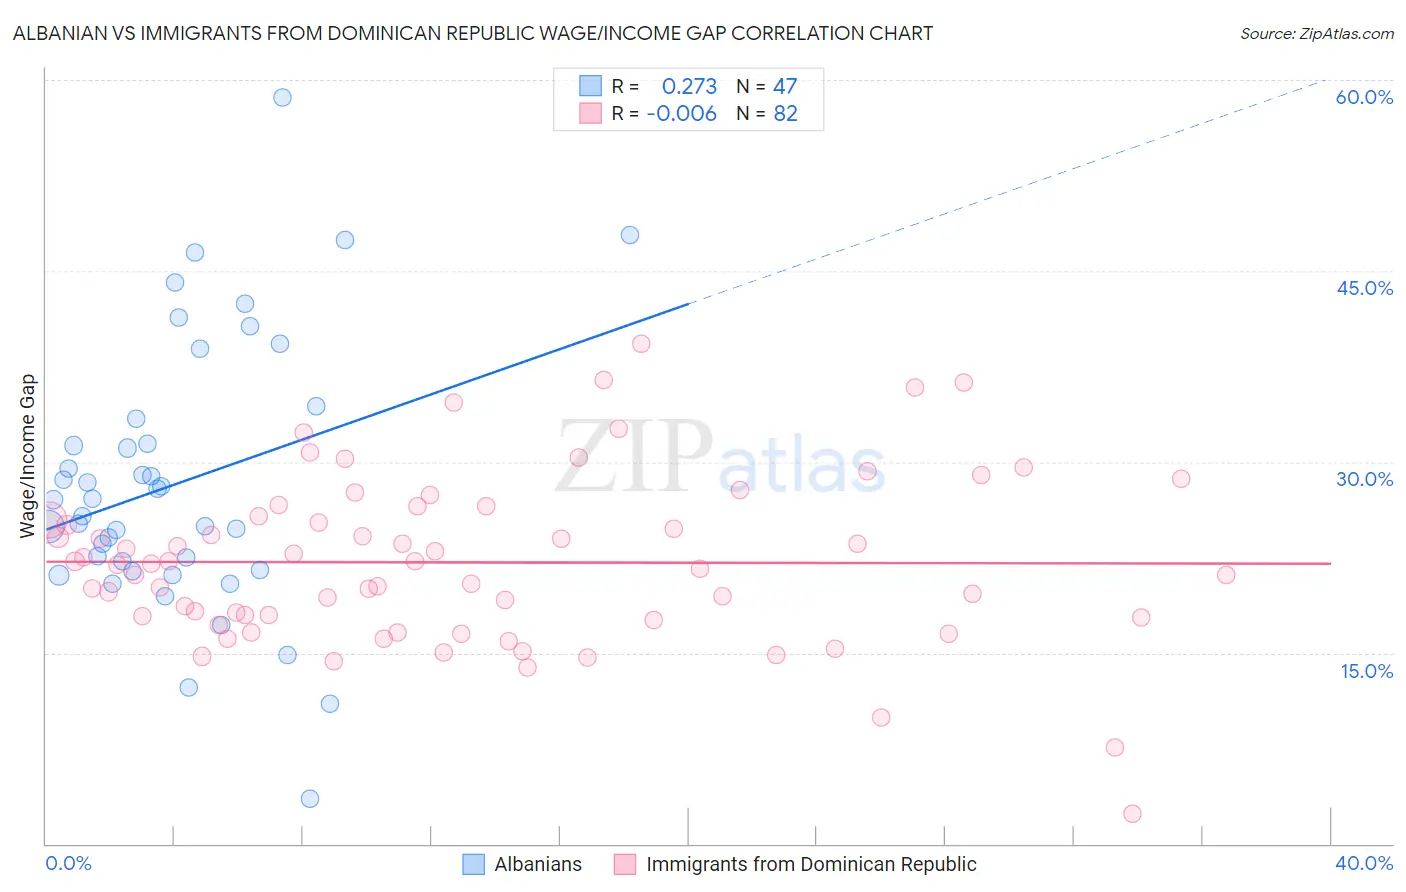
Albanian vs Immigrants from Dominican Republic Wage/Income Gap Correlation Chart
The statistical analysis conducted on geographies consisting of 193,205,458 people shows a weak positive correlation between the proportion of Albanians and wage/income gap percentage in the United States with a correlation coefficient (R) of 0.273 and weighted average of 25.4%. Similarly, the statistical analysis conducted on geographies consisting of 274,970,009 people shows no correlation between the proportion of Immigrants from Dominican Republic and wage/income gap percentage in the United States with a correlation coefficient (R) of -0.006 and weighted average of 20.6%, a difference of 23.7%.
Wage/Income Gap Correlation Summary
| Measurement | Albanian | Immigrants from Dominican Republic |
| Minimum | 3.5% | 2.4% |
| Maximum | 58.7% | 39.3% |
| Range | 55.2% | 36.9% |
| Mean | 28.3% | 22.1% |
| Median | 27.0% | 22.0% |
| Interquartile 25% (IQ1) | 21.5% | 17.7% |
| Interquartile 75% (IQ3) | 33.4% | 25.7% |
| Interquartile Range (IQR) | 11.9% | 8.0% |
| Standard Deviation (Sample) | 10.6% | 6.6% |
| Standard Deviation (Population) | 10.5% | 6.6% |
Similar Demographics by Wage/Income Gap
Demographics Similar to Albanians by Wage/Income Gap
In terms of wage/income gap, the demographic groups most similar to Albanians are Shoshone (25.4%, a difference of 0.030%), Native Hawaiian (25.4%, a difference of 0.030%), Korean (25.4%, a difference of 0.060%), French American Indian (25.4%, a difference of 0.26%), and Puget Sound Salish (25.3%, a difference of 0.29%).
| Demographics | Rating | Rank | Wage/Income Gap |
| Immigrants | Northern Africa | 78.1 /100 | #154 | Good 25.2% |
| Immigrants | Vietnam | 77.7 /100 | #155 | Good 25.2% |
| Immigrants | Mexico | 76.4 /100 | #156 | Good 25.3% |
| Costa Ricans | 75.8 /100 | #157 | Good 25.3% |
| Immigrants | Zimbabwe | 73.7 /100 | #158 | Good 25.3% |
| Puget Sound Salish | 73.0 /100 | #159 | Good 25.3% |
| French American Indians | 72.5 /100 | #160 | Good 25.4% |
| Albanians | 69.4 /100 | #161 | Good 25.4% |
| Shoshone | 69.0 /100 | #162 | Good 25.4% |
| Native Hawaiians | 69.0 /100 | #163 | Good 25.4% |
| Koreans | 68.6 /100 | #164 | Good 25.4% |
| Immigrants | Hong Kong | 64.0 /100 | #165 | Good 25.5% |
| Immigrants | Ukraine | 63.8 /100 | #166 | Good 25.5% |
| Paiute | 62.9 /100 | #167 | Good 25.5% |
| Seminole | 62.6 /100 | #168 | Good 25.6% |
Demographics Similar to Immigrants from Dominican Republic by Wage/Income Gap
In terms of wage/income gap, the demographic groups most similar to Immigrants from Dominican Republic are Immigrants from Liberia (20.6%, a difference of 0.020%), Dominican (20.6%, a difference of 0.17%), Senegalese (20.7%, a difference of 0.47%), Pueblo (20.7%, a difference of 0.58%), and Immigrants from Armenia (20.7%, a difference of 0.78%).
| Demographics | Rating | Rank | Wage/Income Gap |
| Jamaicans | 100.0 /100 | #16 | Exceptional 19.6% |
| Haitians | 100.0 /100 | #17 | Exceptional 19.7% |
| Hopi | 100.0 /100 | #18 | Exceptional 20.0% |
| Immigrants | Dominica | 100.0 /100 | #19 | Exceptional 20.0% |
| Bahamians | 100.0 /100 | #20 | Exceptional 20.2% |
| Immigrants | Caribbean | 100.0 /100 | #21 | Exceptional 20.4% |
| Immigrants | Liberia | 100.0 /100 | #22 | Exceptional 20.6% |
| Immigrants | Dominican Republic | 100.0 /100 | #23 | Exceptional 20.6% |
| Dominicans | 100.0 /100 | #24 | Exceptional 20.6% |
| Senegalese | 100.0 /100 | #25 | Exceptional 20.7% |
| Pueblo | 100.0 /100 | #26 | Exceptional 20.7% |
| Immigrants | Armenia | 100.0 /100 | #27 | Exceptional 20.7% |
| Inupiat | 100.0 /100 | #28 | Exceptional 20.8% |
| Immigrants | Senegal | 100.0 /100 | #29 | Exceptional 20.9% |
| Immigrants | Bangladesh | 100.0 /100 | #30 | Exceptional 20.9% |