Comanche vs Immigrants from Dominican Republic In Labor Force | Age 16-19
COMPARE
Comanche
Immigrants from Dominican Republic
In Labor Force | Age 16-19
In Labor Force | Age 16-19 Comparison
Comanche
Immigrants from Dominican Republic
37.7%
IN LABOR FORCE | AGE 16-19
91.9/ 100
METRIC RATING
138th/ 347
METRIC RANK
31.1%
IN LABOR FORCE | AGE 16-19
0.0/ 100
METRIC RATING
326th/ 347
METRIC RANK
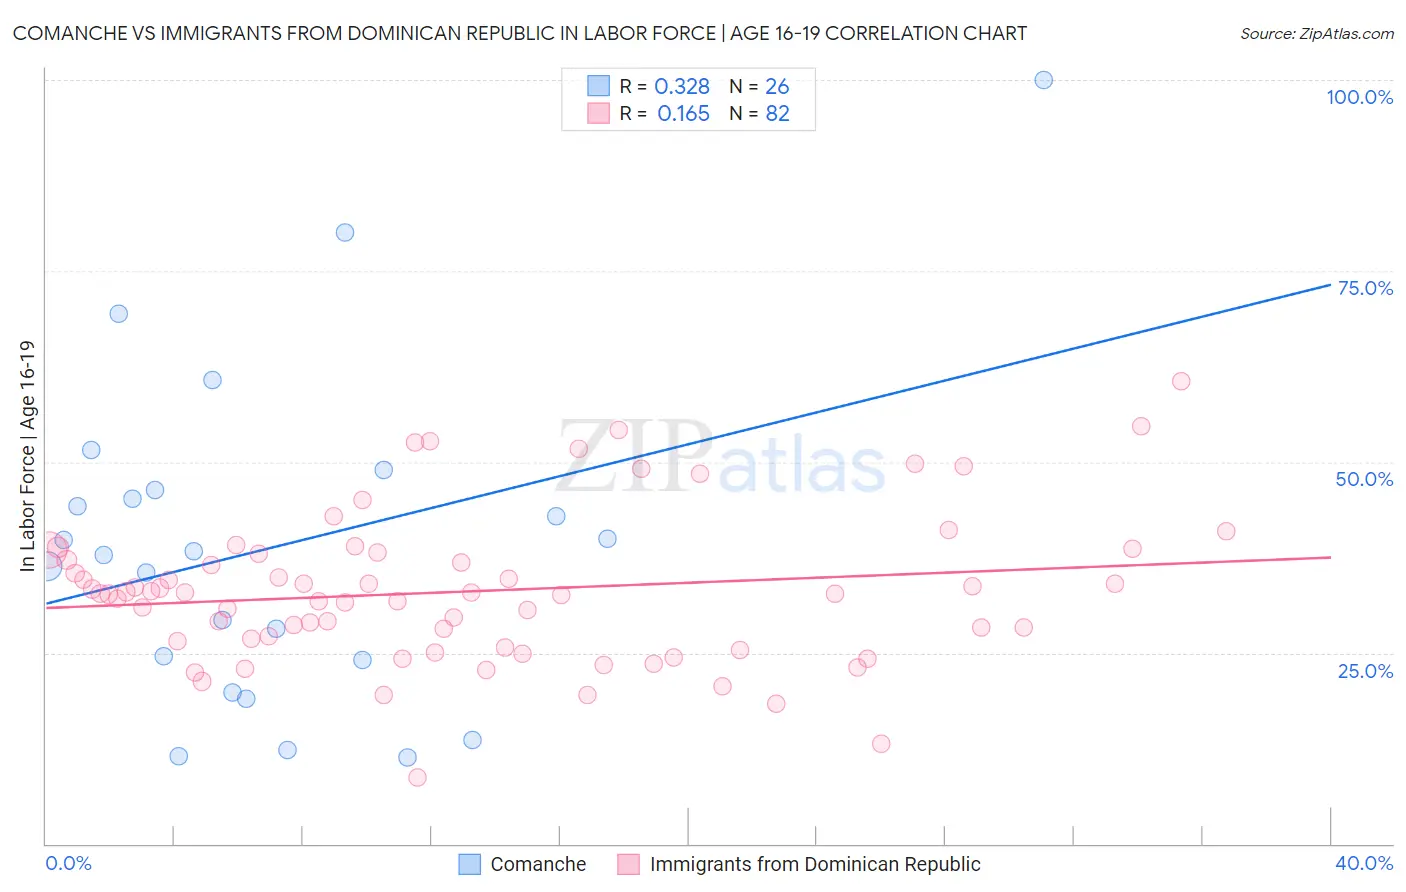
Comanche vs Immigrants from Dominican Republic In Labor Force | Age 16-19 Correlation Chart
The statistical analysis conducted on geographies consisting of 109,736,088 people shows a mild positive correlation between the proportion of Comanche and labor force participation rate among population between the ages 16 and 19 in the United States with a correlation coefficient (R) of 0.328 and weighted average of 37.7%. Similarly, the statistical analysis conducted on geographies consisting of 274,798,225 people shows a poor positive correlation between the proportion of Immigrants from Dominican Republic and labor force participation rate among population between the ages 16 and 19 in the United States with a correlation coefficient (R) of 0.165 and weighted average of 31.1%, a difference of 21.3%.
In Labor Force | Age 16-19 Correlation Summary
| Measurement | Comanche | Immigrants from Dominican Republic |
| Minimum | 11.3% | 8.7% |
| Maximum | 100.0% | 60.5% |
| Range | 88.7% | 51.8% |
| Mean | 38.8% | 33.0% |
| Median | 38.0% | 32.7% |
| Interquartile 25% (IQ1) | 24.0% | 26.5% |
| Interquartile 75% (IQ3) | 46.3% | 38.0% |
| Interquartile Range (IQR) | 22.3% | 11.5% |
| Standard Deviation (Sample) | 21.5% | 9.7% |
| Standard Deviation (Population) | 21.1% | 9.7% |
Similar Demographics by In Labor Force | Age 16-19
Demographics Similar to Comanche by In Labor Force | Age 16-19
In terms of in labor force | age 16-19, the demographic groups most similar to Comanche are Immigrants from Moldova (37.7%, a difference of 0.010%), Estonian (37.7%, a difference of 0.050%), Syrian (37.6%, a difference of 0.19%), Australian (37.8%, a difference of 0.23%), and Cajun (37.8%, a difference of 0.23%).
| Demographics | Rating | Rank | In Labor Force | Age 16-19 |
| Immigrants | Austria | 95.0 /100 | #131 | Exceptional 37.9% |
| Immigrants | Oceania | 94.7 /100 | #132 | Exceptional 37.9% |
| Cheyenne | 94.6 /100 | #133 | Exceptional 37.9% |
| Immigrants | Netherlands | 93.7 /100 | #134 | Exceptional 37.8% |
| Macedonians | 93.4 /100 | #135 | Exceptional 37.8% |
| Australians | 93.2 /100 | #136 | Exceptional 37.8% |
| Cajuns | 93.2 /100 | #137 | Exceptional 37.8% |
| Comanche | 91.9 /100 | #138 | Exceptional 37.7% |
| Immigrants | Moldova | 91.9 /100 | #139 | Exceptional 37.7% |
| Estonians | 91.7 /100 | #140 | Exceptional 37.7% |
| Syrians | 90.7 /100 | #141 | Exceptional 37.6% |
| Sierra Leoneans | 89.7 /100 | #142 | Excellent 37.6% |
| Pakistanis | 89.5 /100 | #143 | Excellent 37.6% |
| Japanese | 89.3 /100 | #144 | Excellent 37.5% |
| Paiute | 89.3 /100 | #145 | Excellent 37.5% |
Demographics Similar to Immigrants from Dominican Republic by In Labor Force | Age 16-19
In terms of in labor force | age 16-19, the demographic groups most similar to Immigrants from Dominican Republic are Immigrants from Taiwan (31.0%, a difference of 0.16%), Immigrants from China (31.1%, a difference of 0.20%), Immigrants from Ecuador (31.0%, a difference of 0.20%), Barbadian (31.0%, a difference of 0.23%), and Dominican (31.2%, a difference of 0.35%).
| Demographics | Rating | Rank | In Labor Force | Age 16-19 |
| Soviet Union | 0.0 /100 | #319 | Tragic 31.4% |
| Ecuadorians | 0.0 /100 | #320 | Tragic 31.4% |
| West Indians | 0.0 /100 | #321 | Tragic 31.3% |
| Tohono O'odham | 0.0 /100 | #322 | Tragic 31.3% |
| Immigrants | Caribbean | 0.0 /100 | #323 | Tragic 31.2% |
| Dominicans | 0.0 /100 | #324 | Tragic 31.2% |
| Immigrants | China | 0.0 /100 | #325 | Tragic 31.1% |
| Immigrants | Dominican Republic | 0.0 /100 | #326 | Tragic 31.1% |
| Immigrants | Taiwan | 0.0 /100 | #327 | Tragic 31.0% |
| Immigrants | Ecuador | 0.0 /100 | #328 | Tragic 31.0% |
| Barbadians | 0.0 /100 | #329 | Tragic 31.0% |
| Lumbee | 0.0 /100 | #330 | Tragic 31.0% |
| Trinidadians and Tobagonians | 0.0 /100 | #331 | Tragic 30.9% |
| Immigrants | Israel | 0.0 /100 | #332 | Tragic 30.5% |
| Immigrants | Hong Kong | 0.0 /100 | #333 | Tragic 30.5% |