Comanche vs Immigrants from Dominican Republic Self-Care Disability
COMPARE
Comanche
Immigrants from Dominican Republic
Self-Care Disability
Self-Care Disability Comparison
Comanche
Immigrants from Dominican Republic
2.9%
SELF-CARE DISABILITY
0.0/ 100
METRIC RATING
322nd/ 347
METRIC RANK
3.0%
SELF-CARE DISABILITY
0.0/ 100
METRIC RATING
339th/ 347
METRIC RANK
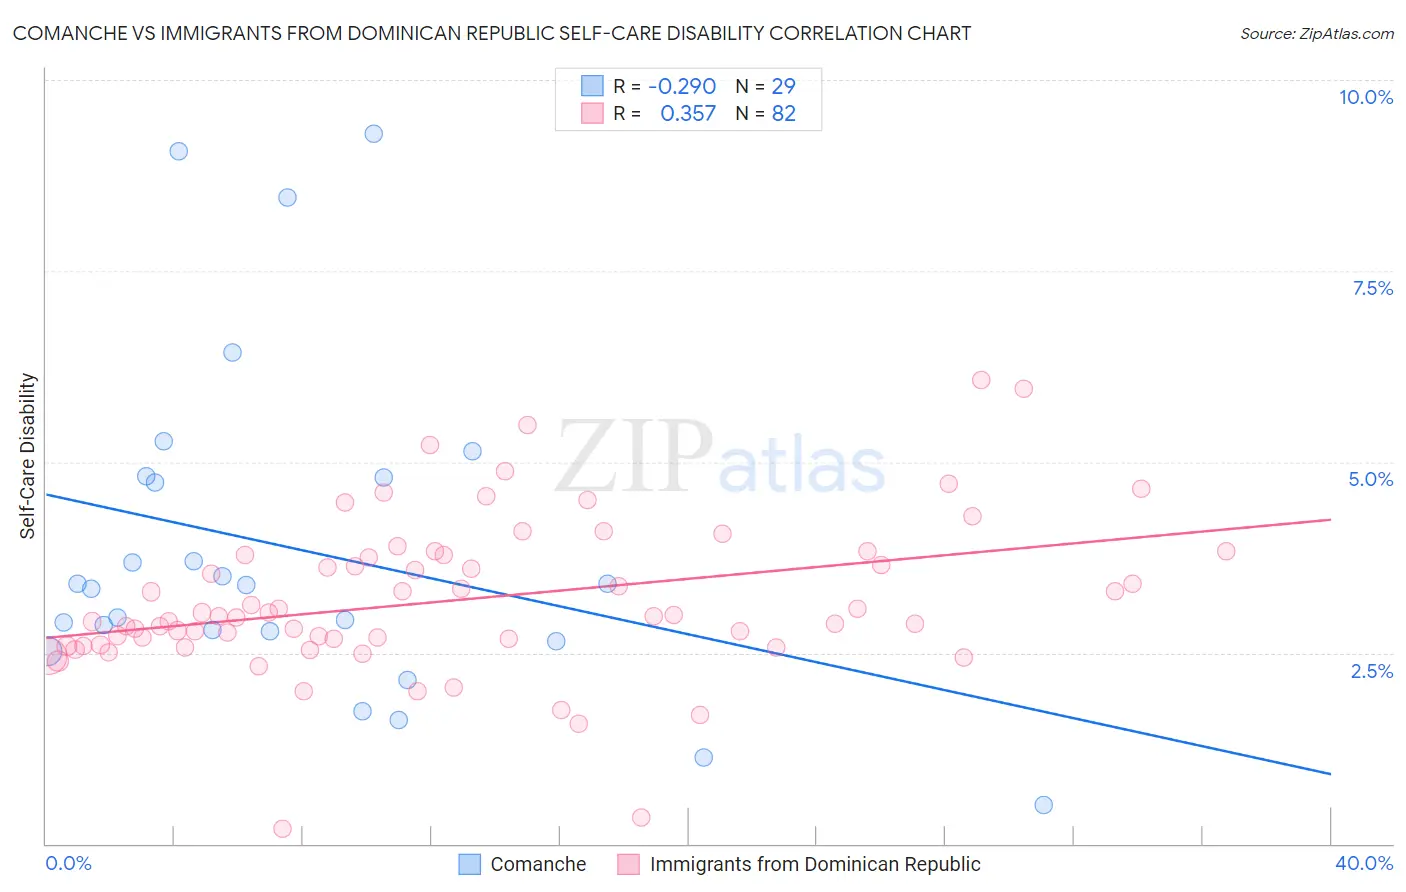
Comanche vs Immigrants from Dominican Republic Self-Care Disability Correlation Chart
The statistical analysis conducted on geographies consisting of 109,703,809 people shows a weak negative correlation between the proportion of Comanche and percentage of population with self-care disability in the United States with a correlation coefficient (R) of -0.290 and weighted average of 2.9%. Similarly, the statistical analysis conducted on geographies consisting of 274,850,038 people shows a mild positive correlation between the proportion of Immigrants from Dominican Republic and percentage of population with self-care disability in the United States with a correlation coefficient (R) of 0.357 and weighted average of 3.0%, a difference of 6.0%.
Self-Care Disability Correlation Summary
| Measurement | Comanche | Immigrants from Dominican Republic |
| Minimum | 0.50% | 0.19% |
| Maximum | 9.3% | 6.1% |
| Range | 8.8% | 5.9% |
| Mean | 3.9% | 3.2% |
| Median | 3.4% | 3.0% |
| Interquartile 25% (IQ1) | 2.7% | 2.6% |
| Interquartile 75% (IQ3) | 4.8% | 3.8% |
| Interquartile Range (IQR) | 2.1% | 1.2% |
| Standard Deviation (Sample) | 2.2% | 1.0% |
| Standard Deviation (Population) | 2.1% | 1.0% |
Demographics Similar to Comanche and Immigrants from Dominican Republic by Self-Care Disability
In terms of self-care disability, the demographic groups most similar to Comanche are Seminole (2.9%, a difference of 0.12%), Cherokee (2.9%, a difference of 0.22%), Navajo (2.9%, a difference of 0.32%), Chickasaw (2.9%, a difference of 0.47%), and Immigrants from Uzbekistan (2.9%, a difference of 0.75%). Similarly, the demographic groups most similar to Immigrants from Dominican Republic are Immigrants from Cabo Verde (3.1%, a difference of 0.33%), Cape Verdean (3.0%, a difference of 0.38%), Choctaw (3.0%, a difference of 0.69%), Immigrants from Yemen (3.0%, a difference of 1.8%), and Immigrants from the Azores (3.0%, a difference of 1.9%).
| Demographics | Rating | Rank | Self-Care Disability |
| Chickasaw | 0.0 /100 | #320 | Tragic 2.9% |
| Navajo | 0.0 /100 | #321 | Tragic 2.9% |
| Comanche | 0.0 /100 | #322 | Tragic 2.9% |
| Seminole | 0.0 /100 | #323 | Tragic 2.9% |
| Cherokee | 0.0 /100 | #324 | Tragic 2.9% |
| Immigrants | Uzbekistan | 0.0 /100 | #325 | Tragic 2.9% |
| Paiute | 0.0 /100 | #326 | Tragic 2.9% |
| Blacks/African Americans | 0.0 /100 | #327 | Tragic 2.9% |
| Hopi | 0.0 /100 | #328 | Tragic 2.9% |
| Cajuns | 0.0 /100 | #329 | Tragic 2.9% |
| Nepalese | 0.0 /100 | #330 | Tragic 3.0% |
| Lumbee | 0.0 /100 | #331 | Tragic 3.0% |
| Kiowa | 0.0 /100 | #332 | Tragic 3.0% |
| Dutch West Indians | 0.0 /100 | #333 | Tragic 3.0% |
| Houma | 0.0 /100 | #334 | Tragic 3.0% |
| Immigrants | Azores | 0.0 /100 | #335 | Tragic 3.0% |
| Immigrants | Yemen | 0.0 /100 | #336 | Tragic 3.0% |
| Choctaw | 0.0 /100 | #337 | Tragic 3.0% |
| Cape Verdeans | 0.0 /100 | #338 | Tragic 3.0% |
| Immigrants | Dominican Republic | 0.0 /100 | #339 | Tragic 3.0% |
| Immigrants | Cabo Verde | 0.0 /100 | #340 | Tragic 3.1% |