Immigrants from Sri Lanka vs Immigrants from Dominican Republic Wage/Income Gap
COMPARE
Immigrants from Sri Lanka
Immigrants from Dominican Republic
Wage/Income Gap
Wage/Income Gap Comparison
Immigrants from Sri Lanka
Immigrants from Dominican Republic
27.1%
WAGE/INCOME GAP
3.7/ 100
METRIC RATING
242nd/ 347
METRIC RANK
20.6%
WAGE/INCOME GAP
100.0/ 100
METRIC RATING
23rd/ 347
METRIC RANK
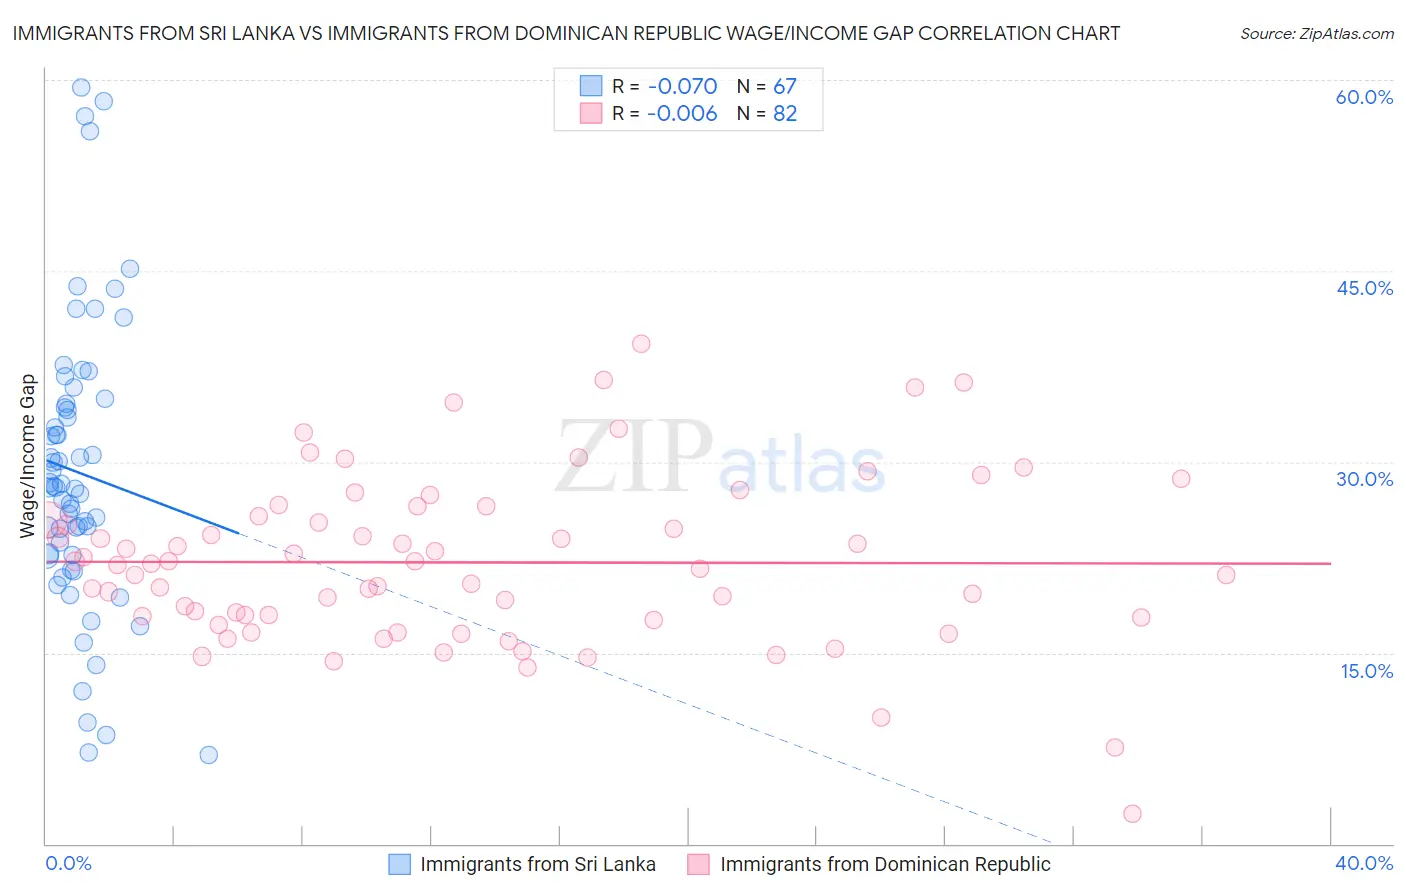
Immigrants from Sri Lanka vs Immigrants from Dominican Republic Wage/Income Gap Correlation Chart
The statistical analysis conducted on geographies consisting of 149,684,649 people shows a slight negative correlation between the proportion of Immigrants from Sri Lanka and wage/income gap percentage in the United States with a correlation coefficient (R) of -0.070 and weighted average of 27.1%. Similarly, the statistical analysis conducted on geographies consisting of 274,970,009 people shows no correlation between the proportion of Immigrants from Dominican Republic and wage/income gap percentage in the United States with a correlation coefficient (R) of -0.006 and weighted average of 20.6%, a difference of 32.0%.
Wage/Income Gap Correlation Summary
| Measurement | Immigrants from Sri Lanka | Immigrants from Dominican Republic |
| Minimum | 7.0% | 2.4% |
| Maximum | 59.4% | 39.3% |
| Range | 52.4% | 36.9% |
| Mean | 29.2% | 22.1% |
| Median | 28.0% | 22.0% |
| Interquartile 25% (IQ1) | 22.7% | 17.7% |
| Interquartile 75% (IQ3) | 34.6% | 25.7% |
| Interquartile Range (IQR) | 11.8% | 8.0% |
| Standard Deviation (Sample) | 11.3% | 6.6% |
| Standard Deviation (Population) | 11.2% | 6.6% |
Similar Demographics by Wage/Income Gap
Demographics Similar to Immigrants from Sri Lanka by Wage/Income Gap
In terms of wage/income gap, the demographic groups most similar to Immigrants from Sri Lanka are Spanish (27.1%, a difference of 0.010%), Creek (27.1%, a difference of 0.050%), Immigrants from Europe (27.1%, a difference of 0.070%), Chickasaw (27.2%, a difference of 0.080%), and Immigrants from the Azores (27.2%, a difference of 0.090%).
| Demographics | Rating | Rank | Wage/Income Gap |
| Immigrants | Hungary | 4.8 /100 | #235 | Tragic 27.0% |
| Immigrants | Romania | 4.8 /100 | #236 | Tragic 27.0% |
| Immigrants | Eastern Asia | 4.4 /100 | #237 | Tragic 27.1% |
| Osage | 4.4 /100 | #238 | Tragic 27.1% |
| Estonians | 4.3 /100 | #239 | Tragic 27.1% |
| Immigrants | Europe | 3.8 /100 | #240 | Tragic 27.1% |
| Creek | 3.8 /100 | #241 | Tragic 27.1% |
| Immigrants | Sri Lanka | 3.7 /100 | #242 | Tragic 27.1% |
| Spanish | 3.6 /100 | #243 | Tragic 27.1% |
| Chickasaw | 3.5 /100 | #244 | Tragic 27.2% |
| Immigrants | Azores | 3.5 /100 | #245 | Tragic 27.2% |
| Immigrants | Nonimmigrants | 3.3 /100 | #246 | Tragic 27.2% |
| Celtics | 2.8 /100 | #247 | Tragic 27.3% |
| Cypriots | 2.8 /100 | #248 | Tragic 27.3% |
| Carpatho Rusyns | 2.7 /100 | #249 | Tragic 27.3% |
Demographics Similar to Immigrants from Dominican Republic by Wage/Income Gap
In terms of wage/income gap, the demographic groups most similar to Immigrants from Dominican Republic are Immigrants from Liberia (20.6%, a difference of 0.020%), Dominican (20.6%, a difference of 0.17%), Senegalese (20.7%, a difference of 0.47%), Pueblo (20.7%, a difference of 0.58%), and Immigrants from Armenia (20.7%, a difference of 0.78%).
| Demographics | Rating | Rank | Wage/Income Gap |
| Jamaicans | 100.0 /100 | #16 | Exceptional 19.6% |
| Haitians | 100.0 /100 | #17 | Exceptional 19.7% |
| Hopi | 100.0 /100 | #18 | Exceptional 20.0% |
| Immigrants | Dominica | 100.0 /100 | #19 | Exceptional 20.0% |
| Bahamians | 100.0 /100 | #20 | Exceptional 20.2% |
| Immigrants | Caribbean | 100.0 /100 | #21 | Exceptional 20.4% |
| Immigrants | Liberia | 100.0 /100 | #22 | Exceptional 20.6% |
| Immigrants | Dominican Republic | 100.0 /100 | #23 | Exceptional 20.6% |
| Dominicans | 100.0 /100 | #24 | Exceptional 20.6% |
| Senegalese | 100.0 /100 | #25 | Exceptional 20.7% |
| Pueblo | 100.0 /100 | #26 | Exceptional 20.7% |
| Immigrants | Armenia | 100.0 /100 | #27 | Exceptional 20.7% |
| Inupiat | 100.0 /100 | #28 | Exceptional 20.8% |
| Immigrants | Senegal | 100.0 /100 | #29 | Exceptional 20.9% |
| Immigrants | Bangladesh | 100.0 /100 | #30 | Exceptional 20.9% |