Chickasaw vs Apache Per Capita Income
COMPARE
Chickasaw
Apache
Per Capita Income
Per Capita Income Comparison
Chickasaw
Apache
$36,475
PER CAPITA INCOME
0.0/ 100
METRIC RATING
312th/ 347
METRIC RANK
$34,886
PER CAPITA INCOME
0.0/ 100
METRIC RATING
327th/ 347
METRIC RANK
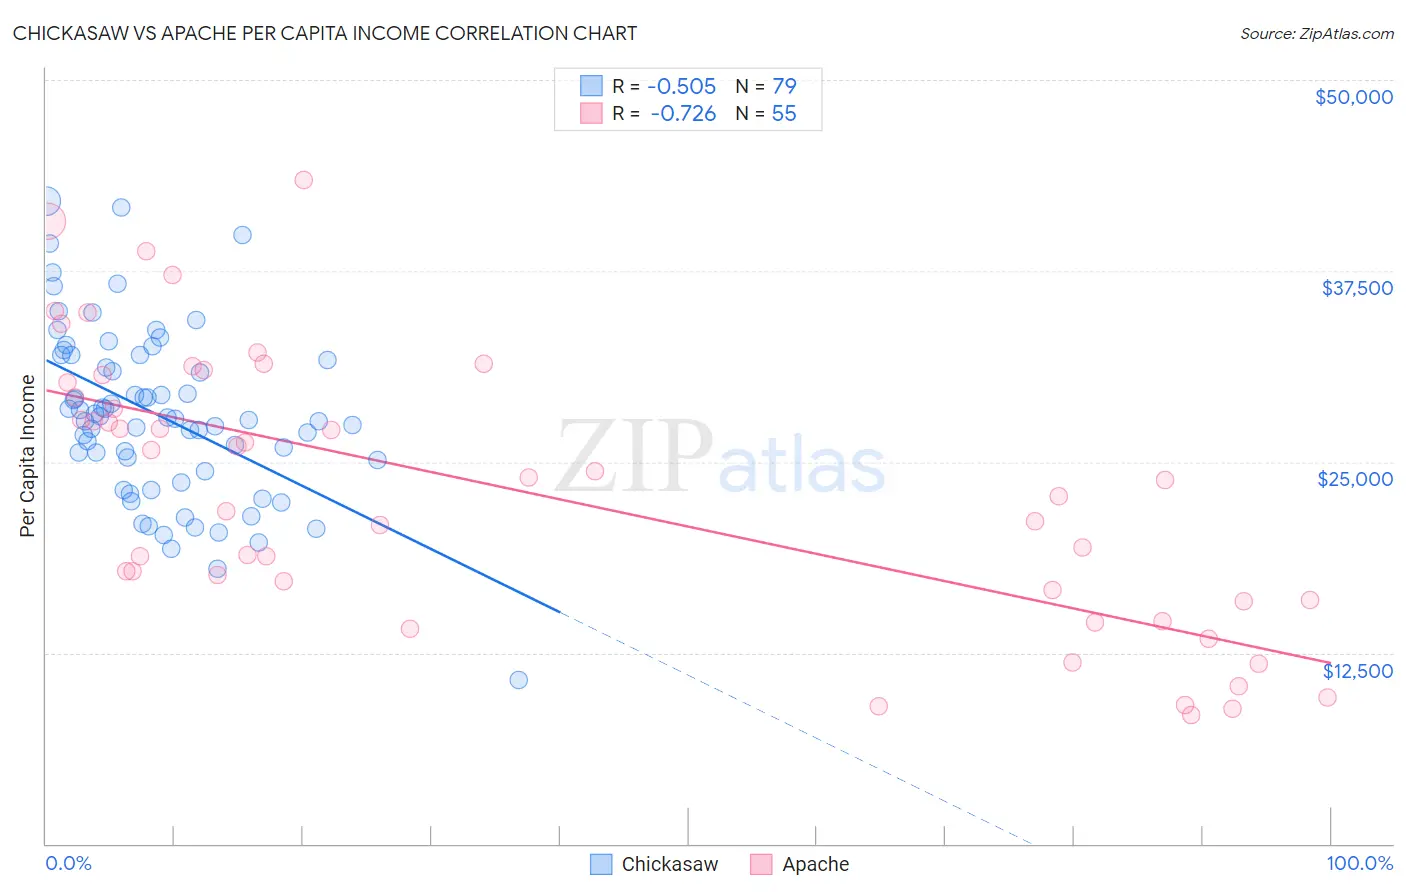
Chickasaw vs Apache Per Capita Income Correlation Chart
The statistical analysis conducted on geographies consisting of 147,726,791 people shows a substantial negative correlation between the proportion of Chickasaw and per capita income in the United States with a correlation coefficient (R) of -0.505 and weighted average of $36,475. Similarly, the statistical analysis conducted on geographies consisting of 231,148,099 people shows a strong negative correlation between the proportion of Apache and per capita income in the United States with a correlation coefficient (R) of -0.726 and weighted average of $34,886, a difference of 4.6%.
Per Capita Income Correlation Summary
| Measurement | Chickasaw | Apache |
| Minimum | $10,758 | $8,398 |
| Maximum | $42,047 | $43,430 |
| Range | $31,289 | $35,032 |
| Mean | $28,009 | $23,117 |
| Median | $27,826 | $23,775 |
| Interquartile 25% (IQ1) | $24,362 | $15,985 |
| Interquartile 75% (IQ3) | $31,977 | $30,233 |
| Interquartile Range (IQR) | $7,616 | $14,248 |
| Standard Deviation (Sample) | $5,659 | $8,932 |
| Standard Deviation (Population) | $5,624 | $8,851 |
Demographics Similar to Chickasaw and Apache by Per Capita Income
In terms of per capita income, the demographic groups most similar to Chickasaw are Bahamian ($36,427, a difference of 0.13%), Chippewa ($36,631, a difference of 0.43%), Ute ($36,651, a difference of 0.48%), Immigrants from Honduras ($36,665, a difference of 0.52%), and Seminole ($36,180, a difference of 0.81%). Similarly, the demographic groups most similar to Apache are Immigrants from Cuba ($34,910, a difference of 0.070%), Immigrants from Central America ($34,974, a difference of 0.25%), Kiowa ($35,102, a difference of 0.62%), Menominee ($34,578, a difference of 0.89%), and Mexican ($34,559, a difference of 0.95%).
| Demographics | Rating | Rank | Per Capita Income |
| Immigrants | Honduras | 0.0 /100 | #309 | Tragic $36,665 |
| Ute | 0.0 /100 | #310 | Tragic $36,651 |
| Chippewa | 0.0 /100 | #311 | Tragic $36,631 |
| Chickasaw | 0.0 /100 | #312 | Tragic $36,475 |
| Bahamians | 0.0 /100 | #313 | Tragic $36,427 |
| Seminole | 0.0 /100 | #314 | Tragic $36,180 |
| Yaqui | 0.0 /100 | #315 | Tragic $36,112 |
| Choctaw | 0.0 /100 | #316 | Tragic $35,999 |
| Dutch West Indians | 0.0 /100 | #317 | Tragic $35,922 |
| Bangladeshis | 0.0 /100 | #318 | Tragic $35,897 |
| Immigrants | Congo | 0.0 /100 | #319 | Tragic $35,720 |
| Hispanics or Latinos | 0.0 /100 | #320 | Tragic $35,688 |
| Blacks/African Americans | 0.0 /100 | #321 | Tragic $35,564 |
| Creek | 0.0 /100 | #322 | Tragic $35,546 |
| Cheyenne | 0.0 /100 | #323 | Tragic $35,276 |
| Kiowa | 0.0 /100 | #324 | Tragic $35,102 |
| Immigrants | Central America | 0.0 /100 | #325 | Tragic $34,974 |
| Immigrants | Cuba | 0.0 /100 | #326 | Tragic $34,910 |
| Apache | 0.0 /100 | #327 | Tragic $34,886 |
| Menominee | 0.0 /100 | #328 | Tragic $34,578 |
| Mexicans | 0.0 /100 | #329 | Tragic $34,559 |