Chickasaw vs Immigrants from Austria Per Capita Income
COMPARE
Chickasaw
Immigrants from Austria
Per Capita Income
Per Capita Income Comparison
Chickasaw
Immigrants from Austria
$36,475
PER CAPITA INCOME
0.0/ 100
METRIC RATING
312th/ 347
METRIC RANK
$52,503
PER CAPITA INCOME
100.0/ 100
METRIC RATING
30th/ 347
METRIC RANK
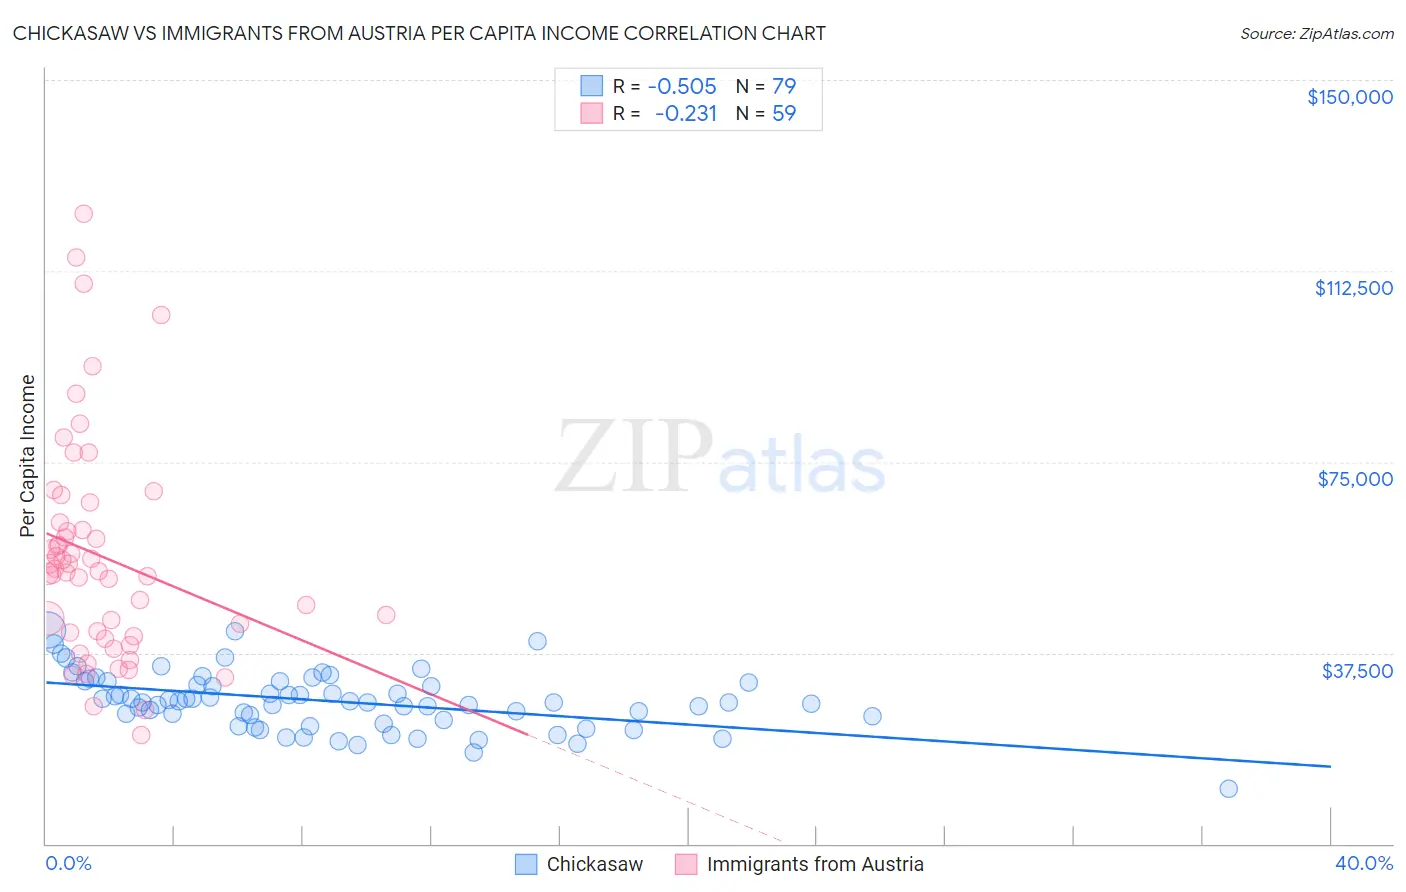
Chickasaw vs Immigrants from Austria Per Capita Income Correlation Chart
The statistical analysis conducted on geographies consisting of 147,726,791 people shows a substantial negative correlation between the proportion of Chickasaw and per capita income in the United States with a correlation coefficient (R) of -0.505 and weighted average of $36,475. Similarly, the statistical analysis conducted on geographies consisting of 167,970,589 people shows a weak negative correlation between the proportion of Immigrants from Austria and per capita income in the United States with a correlation coefficient (R) of -0.231 and weighted average of $52,503, a difference of 43.9%.
Per Capita Income Correlation Summary
| Measurement | Chickasaw | Immigrants from Austria |
| Minimum | $10,758 | $21,347 |
| Maximum | $42,047 | $123,682 |
| Range | $31,289 | $102,335 |
| Mean | $28,009 | $56,412 |
| Median | $27,826 | $53,535 |
| Interquartile 25% (IQ1) | $24,362 | $40,769 |
| Interquartile 75% (IQ3) | $31,977 | $63,066 |
| Interquartile Range (IQR) | $7,616 | $22,297 |
| Standard Deviation (Sample) | $5,659 | $21,800 |
| Standard Deviation (Population) | $5,624 | $21,614 |
Similar Demographics by Per Capita Income
Demographics Similar to Chickasaw by Per Capita Income
In terms of per capita income, the demographic groups most similar to Chickasaw are Bahamian ($36,427, a difference of 0.13%), Chippewa ($36,631, a difference of 0.43%), Ute ($36,651, a difference of 0.48%), Immigrants from Honduras ($36,665, a difference of 0.52%), and Fijian ($36,690, a difference of 0.59%).
| Demographics | Rating | Rank | Per Capita Income |
| Inupiat | 0.1 /100 | #305 | Tragic $36,999 |
| Immigrants | Haiti | 0.0 /100 | #306 | Tragic $36,849 |
| Immigrants | Latin America | 0.0 /100 | #307 | Tragic $36,823 |
| Fijians | 0.0 /100 | #308 | Tragic $36,690 |
| Immigrants | Honduras | 0.0 /100 | #309 | Tragic $36,665 |
| Ute | 0.0 /100 | #310 | Tragic $36,651 |
| Chippewa | 0.0 /100 | #311 | Tragic $36,631 |
| Chickasaw | 0.0 /100 | #312 | Tragic $36,475 |
| Bahamians | 0.0 /100 | #313 | Tragic $36,427 |
| Seminole | 0.0 /100 | #314 | Tragic $36,180 |
| Yaqui | 0.0 /100 | #315 | Tragic $36,112 |
| Choctaw | 0.0 /100 | #316 | Tragic $35,999 |
| Dutch West Indians | 0.0 /100 | #317 | Tragic $35,922 |
| Bangladeshis | 0.0 /100 | #318 | Tragic $35,897 |
| Immigrants | Congo | 0.0 /100 | #319 | Tragic $35,720 |
Demographics Similar to Immigrants from Austria by Per Capita Income
In terms of per capita income, the demographic groups most similar to Immigrants from Austria are Israeli ($52,596, a difference of 0.18%), Turkish ($52,391, a difference of 0.21%), Latvian ($52,649, a difference of 0.28%), Immigrants from South Central Asia ($52,660, a difference of 0.30%), and Immigrants from Norway ($52,217, a difference of 0.55%).
| Demographics | Rating | Rank | Per Capita Income |
| Immigrants | Eastern Asia | 100.0 /100 | #23 | Exceptional $53,806 |
| Immigrants | Denmark | 100.0 /100 | #24 | Exceptional $53,799 |
| Immigrants | Japan | 100.0 /100 | #25 | Exceptional $53,359 |
| Russians | 100.0 /100 | #26 | Exceptional $53,154 |
| Immigrants | South Central Asia | 100.0 /100 | #27 | Exceptional $52,660 |
| Latvians | 100.0 /100 | #28 | Exceptional $52,649 |
| Israelis | 100.0 /100 | #29 | Exceptional $52,596 |
| Immigrants | Austria | 100.0 /100 | #30 | Exceptional $52,503 |
| Turks | 100.0 /100 | #31 | Exceptional $52,391 |
| Immigrants | Norway | 100.0 /100 | #32 | Exceptional $52,217 |
| Australians | 100.0 /100 | #33 | Exceptional $52,074 |
| Immigrants | Russia | 100.0 /100 | #34 | Exceptional $52,044 |
| Burmese | 100.0 /100 | #35 | Exceptional $52,005 |
| Immigrants | Greece | 100.0 /100 | #36 | Exceptional $51,891 |
| Estonians | 100.0 /100 | #37 | Exceptional $51,875 |