Lebanese vs Apache Per Capita Income
COMPARE
Lebanese
Apache
Per Capita Income
Per Capita Income Comparison
Lebanese
Apache
$45,840
PER CAPITA INCOME
92.0/ 100
METRIC RATING
123rd/ 347
METRIC RANK
$34,886
PER CAPITA INCOME
0.0/ 100
METRIC RATING
327th/ 347
METRIC RANK
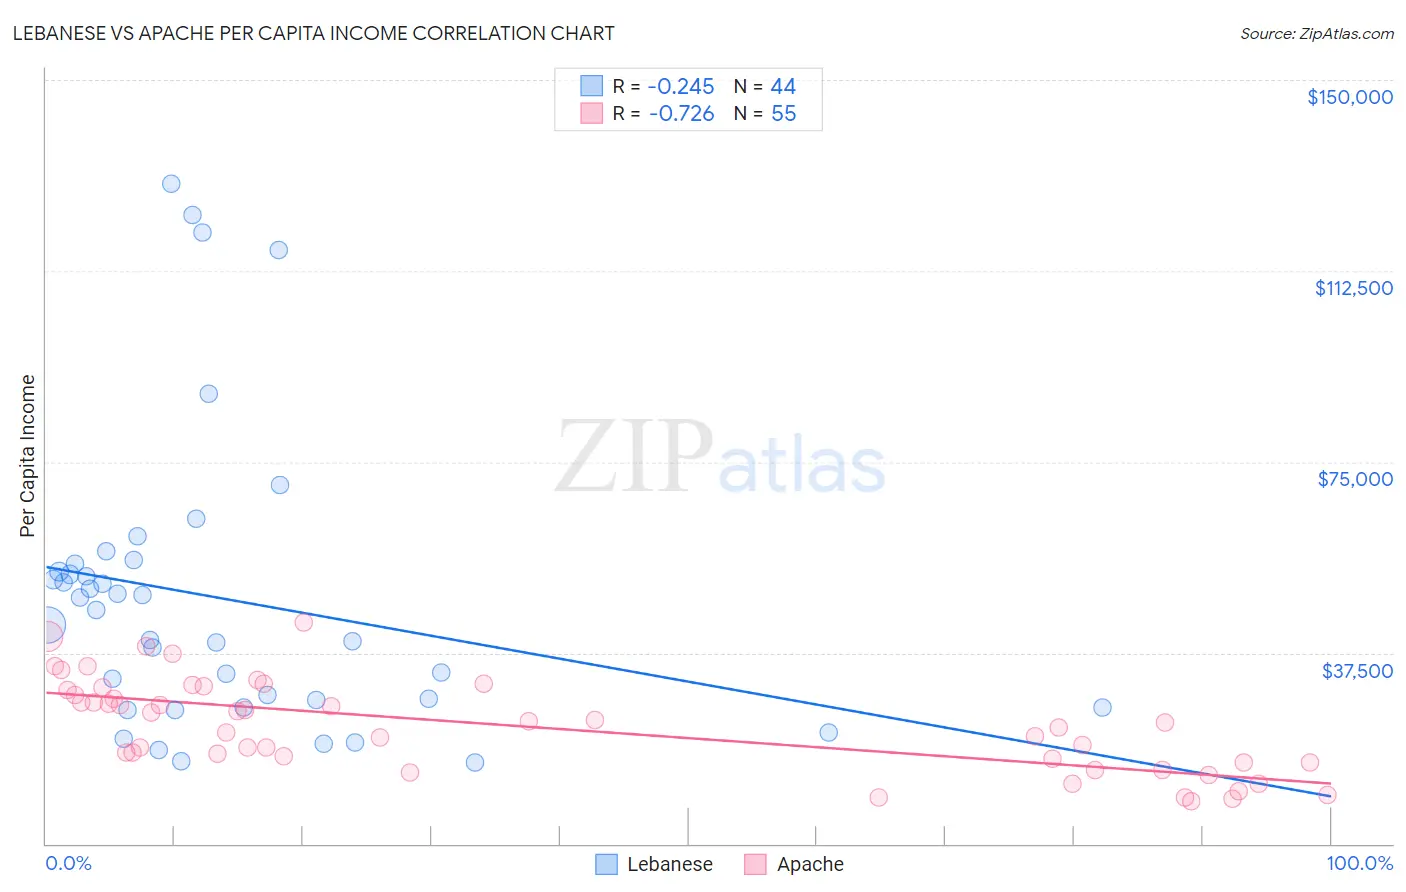
Lebanese vs Apache Per Capita Income Correlation Chart
The statistical analysis conducted on geographies consisting of 401,645,404 people shows a weak negative correlation between the proportion of Lebanese and per capita income in the United States with a correlation coefficient (R) of -0.245 and weighted average of $45,840. Similarly, the statistical analysis conducted on geographies consisting of 231,148,099 people shows a strong negative correlation between the proportion of Apache and per capita income in the United States with a correlation coefficient (R) of -0.726 and weighted average of $34,886, a difference of 31.4%.
Per Capita Income Correlation Summary
| Measurement | Lebanese | Apache |
| Minimum | $15,839 | $8,398 |
| Maximum | $129,581 | $43,430 |
| Range | $113,742 | $35,032 |
| Mean | $48,201 | $23,117 |
| Median | $44,395 | $23,775 |
| Interquartile 25% (IQ1) | $27,415 | $15,985 |
| Interquartile 75% (IQ3) | $54,286 | $30,233 |
| Interquartile Range (IQR) | $26,871 | $14,248 |
| Standard Deviation (Sample) | $28,531 | $8,932 |
| Standard Deviation (Population) | $28,205 | $8,851 |
Similar Demographics by Per Capita Income
Demographics Similar to Lebanese by Per Capita Income
In terms of per capita income, the demographic groups most similar to Lebanese are European ($45,836, a difference of 0.010%), Moroccan ($45,854, a difference of 0.030%), Canadian ($45,858, a difference of 0.040%), Zimbabwean ($45,804, a difference of 0.080%), and Palestinian ($45,790, a difference of 0.11%).
| Demographics | Rating | Rank | Per Capita Income |
| Poles | 94.1 /100 | #116 | Exceptional $46,123 |
| Chinese | 93.9 /100 | #117 | Exceptional $46,098 |
| Immigrants | Saudi Arabia | 93.3 /100 | #118 | Exceptional $46,008 |
| Immigrants | Poland | 93.1 /100 | #119 | Exceptional $45,979 |
| Immigrants | Ethiopia | 92.7 /100 | #120 | Exceptional $45,923 |
| Canadians | 92.2 /100 | #121 | Exceptional $45,858 |
| Moroccans | 92.1 /100 | #122 | Exceptional $45,854 |
| Lebanese | 92.0 /100 | #123 | Exceptional $45,840 |
| Europeans | 92.0 /100 | #124 | Exceptional $45,836 |
| Zimbabweans | 91.7 /100 | #125 | Exceptional $45,804 |
| Palestinians | 91.6 /100 | #126 | Exceptional $45,790 |
| Immigrants | Germany | 91.3 /100 | #127 | Exceptional $45,751 |
| Swedes | 91.3 /100 | #128 | Exceptional $45,750 |
| Luxembourgers | 90.4 /100 | #129 | Exceptional $45,663 |
| Arabs | 90.4 /100 | #130 | Exceptional $45,662 |
Demographics Similar to Apache by Per Capita Income
In terms of per capita income, the demographic groups most similar to Apache are Immigrants from Cuba ($34,910, a difference of 0.070%), Immigrants from Central America ($34,974, a difference of 0.25%), Kiowa ($35,102, a difference of 0.62%), Menominee ($34,578, a difference of 0.89%), and Mexican ($34,559, a difference of 0.95%).
| Demographics | Rating | Rank | Per Capita Income |
| Hispanics or Latinos | 0.0 /100 | #320 | Tragic $35,688 |
| Blacks/African Americans | 0.0 /100 | #321 | Tragic $35,564 |
| Creek | 0.0 /100 | #322 | Tragic $35,546 |
| Cheyenne | 0.0 /100 | #323 | Tragic $35,276 |
| Kiowa | 0.0 /100 | #324 | Tragic $35,102 |
| Immigrants | Central America | 0.0 /100 | #325 | Tragic $34,974 |
| Immigrants | Cuba | 0.0 /100 | #326 | Tragic $34,910 |
| Apache | 0.0 /100 | #327 | Tragic $34,886 |
| Menominee | 0.0 /100 | #328 | Tragic $34,578 |
| Mexicans | 0.0 /100 | #329 | Tragic $34,559 |
| Spanish American Indians | 0.0 /100 | #330 | Tragic $34,195 |
| Immigrants | Mexico | 0.0 /100 | #331 | Tragic $33,931 |
| Sioux | 0.0 /100 | #332 | Tragic $33,921 |
| Immigrants | Yemen | 0.0 /100 | #333 | Tragic $33,696 |
| Natives/Alaskans | 0.0 /100 | #334 | Tragic $33,279 |