Chickasaw vs South American Indian Per Capita Income
COMPARE
Chickasaw
South American Indian
Per Capita Income
Per Capita Income Comparison
Chickasaw
South American Indians
$36,475
PER CAPITA INCOME
0.0/ 100
METRIC RATING
312th/ 347
METRIC RANK
$44,206
PER CAPITA INCOME
64.8/ 100
METRIC RATING
157th/ 347
METRIC RANK
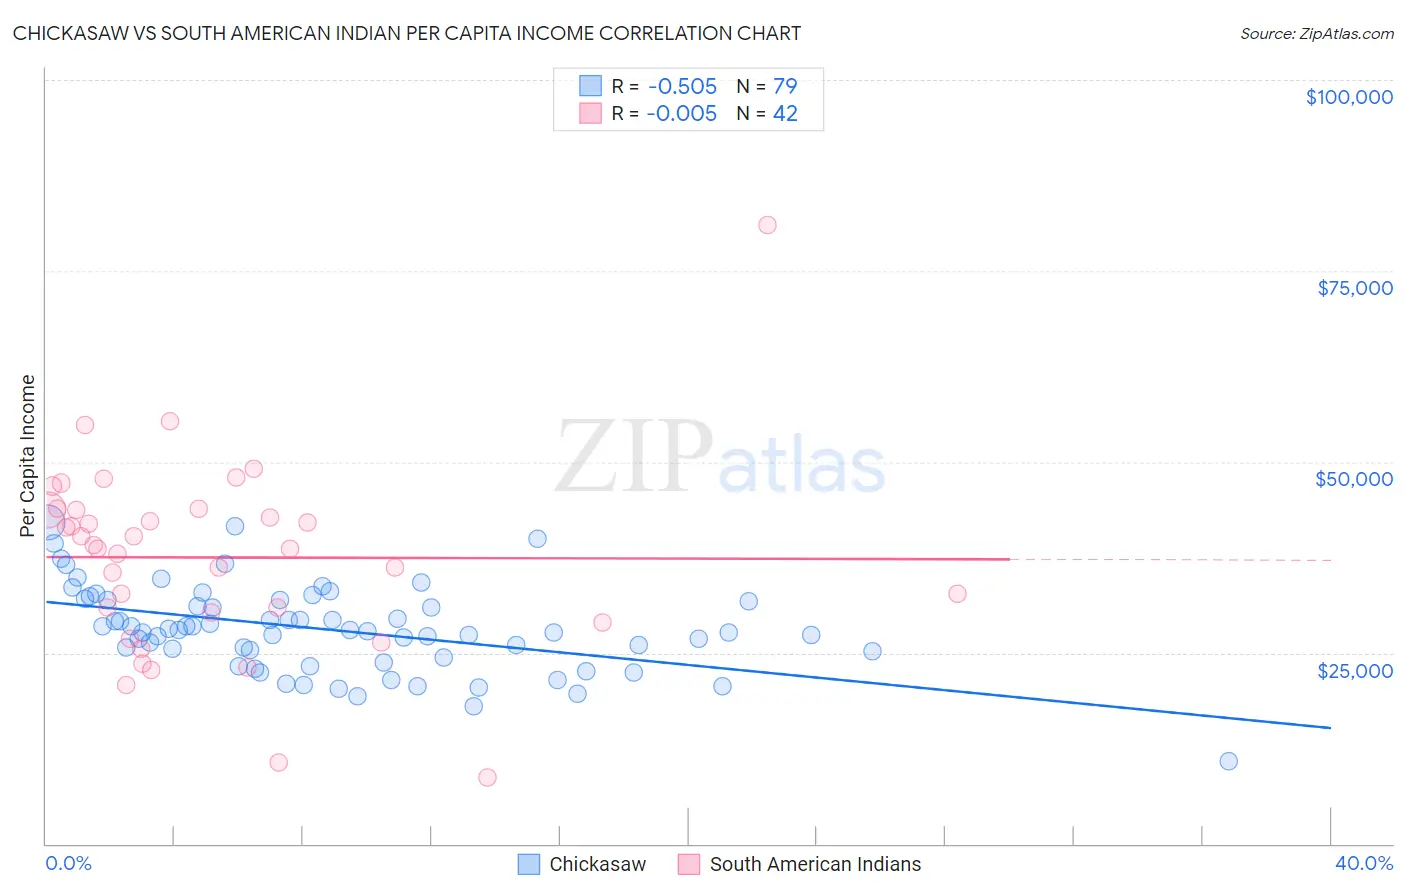
Chickasaw vs South American Indian Per Capita Income Correlation Chart
The statistical analysis conducted on geographies consisting of 147,726,791 people shows a substantial negative correlation between the proportion of Chickasaw and per capita income in the United States with a correlation coefficient (R) of -0.505 and weighted average of $36,475. Similarly, the statistical analysis conducted on geographies consisting of 164,572,672 people shows no correlation between the proportion of South American Indians and per capita income in the United States with a correlation coefficient (R) of -0.005 and weighted average of $44,206, a difference of 21.2%.
Per Capita Income Correlation Summary
| Measurement | Chickasaw | South American Indian |
| Minimum | $10,758 | $8,682 |
| Maximum | $42,047 | $81,082 |
| Range | $31,289 | $72,400 |
| Mean | $28,009 | $37,494 |
| Median | $27,826 | $38,904 |
| Interquartile 25% (IQ1) | $24,362 | $30,264 |
| Interquartile 75% (IQ3) | $31,977 | $43,746 |
| Interquartile Range (IQR) | $7,616 | $13,482 |
| Standard Deviation (Sample) | $5,659 | $12,540 |
| Standard Deviation (Population) | $5,624 | $12,390 |
Similar Demographics by Per Capita Income
Demographics Similar to Chickasaw by Per Capita Income
In terms of per capita income, the demographic groups most similar to Chickasaw are Bahamian ($36,427, a difference of 0.13%), Chippewa ($36,631, a difference of 0.43%), Ute ($36,651, a difference of 0.48%), Immigrants from Honduras ($36,665, a difference of 0.52%), and Fijian ($36,690, a difference of 0.59%).
| Demographics | Rating | Rank | Per Capita Income |
| Inupiat | 0.1 /100 | #305 | Tragic $36,999 |
| Immigrants | Haiti | 0.0 /100 | #306 | Tragic $36,849 |
| Immigrants | Latin America | 0.0 /100 | #307 | Tragic $36,823 |
| Fijians | 0.0 /100 | #308 | Tragic $36,690 |
| Immigrants | Honduras | 0.0 /100 | #309 | Tragic $36,665 |
| Ute | 0.0 /100 | #310 | Tragic $36,651 |
| Chippewa | 0.0 /100 | #311 | Tragic $36,631 |
| Chickasaw | 0.0 /100 | #312 | Tragic $36,475 |
| Bahamians | 0.0 /100 | #313 | Tragic $36,427 |
| Seminole | 0.0 /100 | #314 | Tragic $36,180 |
| Yaqui | 0.0 /100 | #315 | Tragic $36,112 |
| Choctaw | 0.0 /100 | #316 | Tragic $35,999 |
| Dutch West Indians | 0.0 /100 | #317 | Tragic $35,922 |
| Bangladeshis | 0.0 /100 | #318 | Tragic $35,897 |
| Immigrants | Congo | 0.0 /100 | #319 | Tragic $35,720 |
Demographics Similar to South American Indians by Per Capita Income
In terms of per capita income, the demographic groups most similar to South American Indians are Immigrants from Nepal ($44,187, a difference of 0.040%), Slovak ($44,229, a difference of 0.050%), South American ($44,114, a difference of 0.21%), Uruguayan ($44,318, a difference of 0.25%), and Danish ($44,095, a difference of 0.25%).
| Demographics | Rating | Rank | Per Capita Income |
| Immigrants | Eritrea | 72.1 /100 | #150 | Good $44,509 |
| Norwegians | 71.5 /100 | #151 | Good $44,480 |
| Peruvians | 71.5 /100 | #152 | Good $44,479 |
| Scottish | 70.6 /100 | #153 | Good $44,440 |
| Portuguese | 68.7 /100 | #154 | Good $44,362 |
| Uruguayans | 67.6 /100 | #155 | Good $44,318 |
| Slovaks | 65.4 /100 | #156 | Good $44,229 |
| South American Indians | 64.8 /100 | #157 | Good $44,206 |
| Immigrants | Nepal | 64.3 /100 | #158 | Good $44,187 |
| South Americans | 62.4 /100 | #159 | Good $44,114 |
| Danes | 61.9 /100 | #160 | Good $44,095 |
| Costa Ricans | 61.8 /100 | #161 | Good $44,090 |
| Swiss | 61.4 /100 | #162 | Good $44,076 |
| Immigrants | South America | 61.2 /100 | #163 | Good $44,068 |
| Sri Lankans | 59.8 /100 | #164 | Average $44,014 |