Chickasaw vs Apache GED/Equivalency
COMPARE
Chickasaw
Apache
GED/Equivalency
GED/Equivalency Comparison
Chickasaw
Apache
83.8%
GED/EQUIVALENCY
1.2/ 100
METRIC RATING
246th/ 347
METRIC RANK
80.7%
GED/EQUIVALENCY
0.0/ 100
METRIC RATING
315th/ 347
METRIC RANK
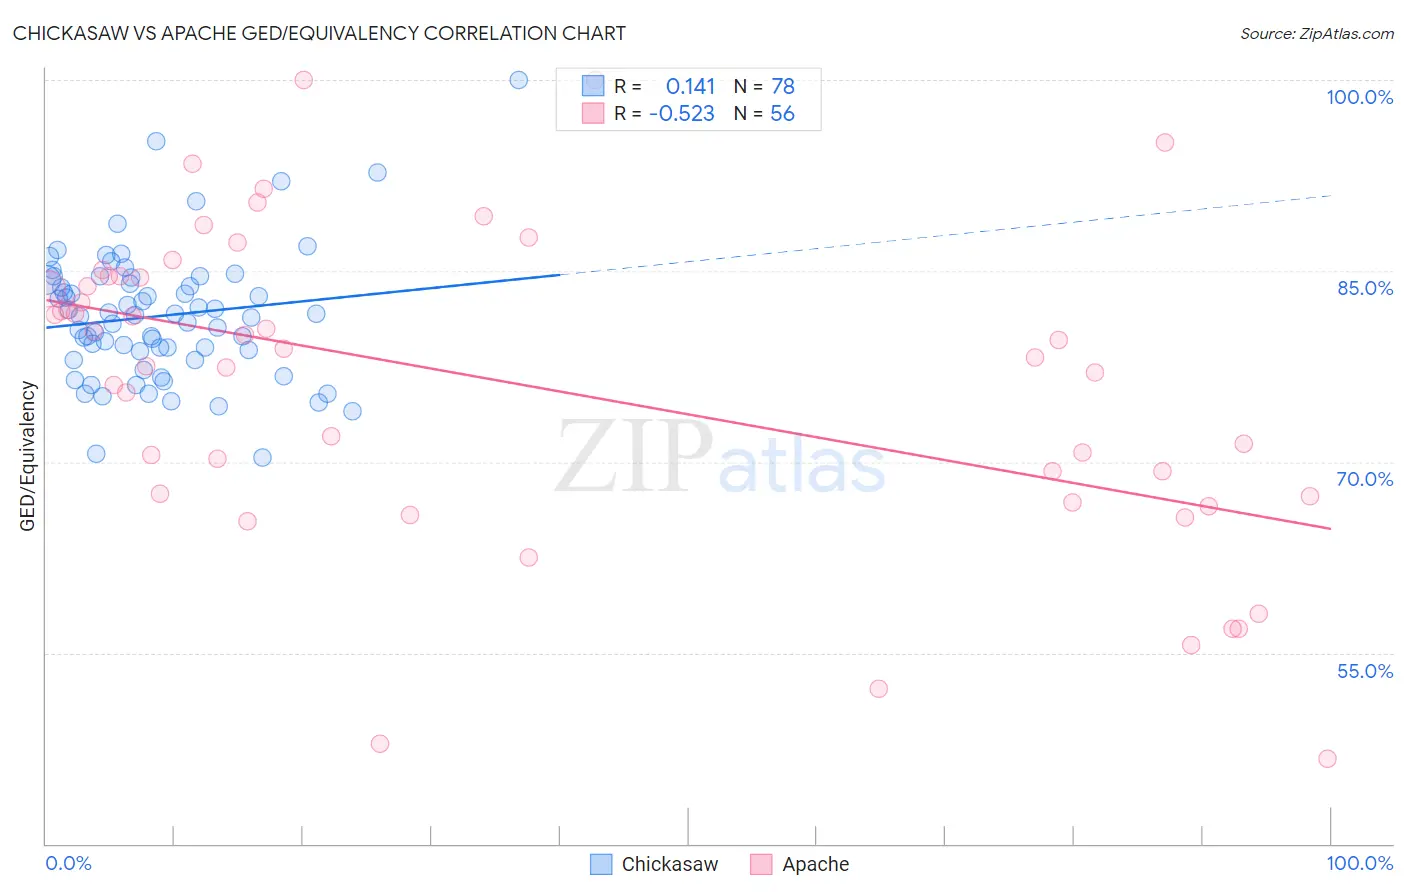
Chickasaw vs Apache GED/Equivalency Correlation Chart
The statistical analysis conducted on geographies consisting of 147,726,505 people shows a poor positive correlation between the proportion of Chickasaw and percentage of population with at least ged/equivalency education in the United States with a correlation coefficient (R) of 0.141 and weighted average of 83.8%. Similarly, the statistical analysis conducted on geographies consisting of 231,143,029 people shows a substantial negative correlation between the proportion of Apache and percentage of population with at least ged/equivalency education in the United States with a correlation coefficient (R) of -0.523 and weighted average of 80.7%, a difference of 3.9%.
GED/Equivalency Correlation Summary
| Measurement | Chickasaw | Apache |
| Minimum | 70.4% | 46.7% |
| Maximum | 100.0% | 100.0% |
| Range | 29.6% | 53.3% |
| Mean | 81.5% | 76.1% |
| Median | 81.5% | 78.5% |
| Interquartile 25% (IQ1) | 78.6% | 67.4% |
| Interquartile 75% (IQ3) | 84.3% | 84.5% |
| Interquartile Range (IQR) | 5.7% | 17.1% |
| Standard Deviation (Sample) | 5.1% | 12.4% |
| Standard Deviation (Population) | 5.1% | 12.2% |
Similar Demographics by GED/Equivalency
Demographics Similar to Chickasaw by GED/Equivalency
In terms of ged/equivalency, the demographic groups most similar to Chickasaw are Immigrants from Senegal (83.8%, a difference of 0.020%), Immigrants from Western Africa (83.8%, a difference of 0.030%), Immigrants from Ghana (83.9%, a difference of 0.050%), Blackfeet (83.8%, a difference of 0.050%), and Crow (83.8%, a difference of 0.050%).
| Demographics | Rating | Rank | GED/Equivalency |
| Immigrants | Bahamas | 2.6 /100 | #239 | Tragic 84.2% |
| Immigrants | South Eastern Asia | 2.5 /100 | #240 | Tragic 84.1% |
| Senegalese | 1.9 /100 | #241 | Tragic 84.0% |
| Sri Lankans | 1.9 /100 | #242 | Tragic 84.0% |
| Cherokee | 1.3 /100 | #243 | Tragic 83.9% |
| Immigrants | Ghana | 1.3 /100 | #244 | Tragic 83.9% |
| Immigrants | Senegal | 1.2 /100 | #245 | Tragic 83.8% |
| Chickasaw | 1.2 /100 | #246 | Tragic 83.8% |
| Immigrants | Western Africa | 1.1 /100 | #247 | Tragic 83.8% |
| Blackfeet | 1.1 /100 | #248 | Tragic 83.8% |
| Crow | 1.1 /100 | #249 | Tragic 83.8% |
| Shoshone | 1.0 /100 | #250 | Tragic 83.7% |
| Spanish Americans | 0.8 /100 | #251 | Tragic 83.6% |
| Bahamians | 0.8 /100 | #252 | Tragic 83.6% |
| Comanche | 0.7 /100 | #253 | Tragic 83.6% |
Demographics Similar to Apache by GED/Equivalency
In terms of ged/equivalency, the demographic groups most similar to Apache are Central American Indian (80.6%, a difference of 0.13%), Immigrants from Caribbean (80.5%, a difference of 0.24%), Belizean (80.9%, a difference of 0.25%), Yaqui (80.5%, a difference of 0.26%), and Immigrants from Belize (80.5%, a difference of 0.26%).
| Demographics | Rating | Rank | GED/Equivalency |
| Puerto Ricans | 0.0 /100 | #308 | Tragic 81.1% |
| Immigrants | Ecuador | 0.0 /100 | #309 | Tragic 81.0% |
| Immigrants | Guyana | 0.0 /100 | #310 | Tragic 81.0% |
| Natives/Alaskans | 0.0 /100 | #311 | Tragic 80.9% |
| Nicaraguans | 0.0 /100 | #312 | Tragic 80.9% |
| Cape Verdeans | 0.0 /100 | #313 | Tragic 80.9% |
| Belizeans | 0.0 /100 | #314 | Tragic 80.9% |
| Apache | 0.0 /100 | #315 | Tragic 80.7% |
| Central American Indians | 0.0 /100 | #316 | Tragic 80.6% |
| Immigrants | Caribbean | 0.0 /100 | #317 | Tragic 80.5% |
| Yaqui | 0.0 /100 | #318 | Tragic 80.5% |
| Immigrants | Belize | 0.0 /100 | #319 | Tragic 80.5% |
| Immigrants | Cuba | 0.0 /100 | #320 | Tragic 80.2% |
| Yup'ik | 0.0 /100 | #321 | Tragic 80.0% |
| Lumbee | 0.0 /100 | #322 | Tragic 80.0% |