Portuguese vs Apache Per Capita Income
COMPARE
Portuguese
Apache
Per Capita Income
Per Capita Income Comparison
Portuguese
Apache
$44,362
PER CAPITA INCOME
68.7/ 100
METRIC RATING
154th/ 347
METRIC RANK
$34,886
PER CAPITA INCOME
0.0/ 100
METRIC RATING
327th/ 347
METRIC RANK
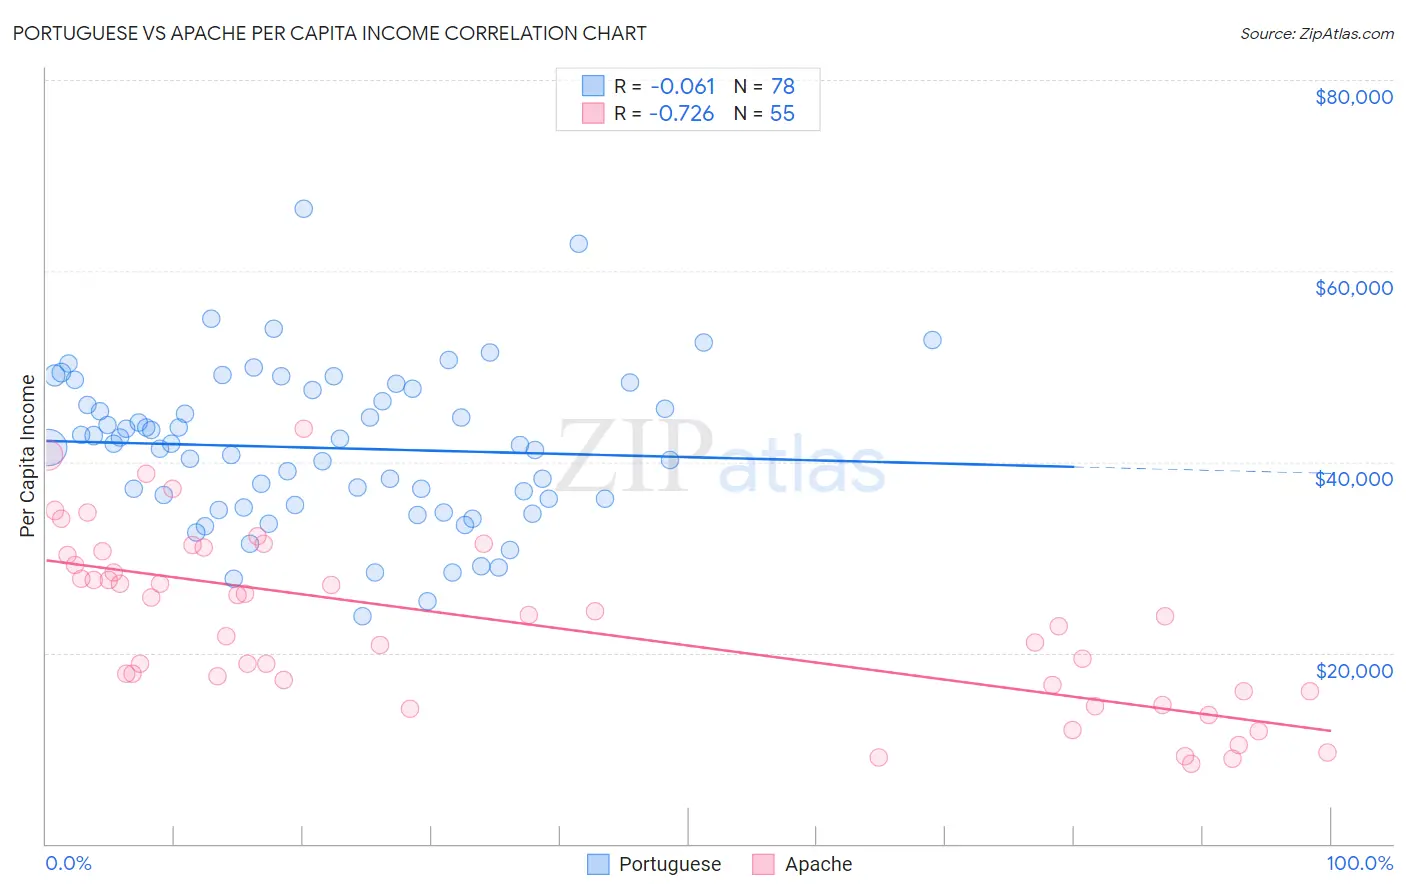
Portuguese vs Apache Per Capita Income Correlation Chart
The statistical analysis conducted on geographies consisting of 450,379,372 people shows a slight negative correlation between the proportion of Portuguese and per capita income in the United States with a correlation coefficient (R) of -0.061 and weighted average of $44,362. Similarly, the statistical analysis conducted on geographies consisting of 231,148,099 people shows a strong negative correlation between the proportion of Apache and per capita income in the United States with a correlation coefficient (R) of -0.726 and weighted average of $34,886, a difference of 27.2%.
Per Capita Income Correlation Summary
| Measurement | Portuguese | Apache |
| Minimum | $23,853 | $8,398 |
| Maximum | $66,467 | $43,430 |
| Range | $42,614 | $35,032 |
| Mean | $41,456 | $23,117 |
| Median | $41,782 | $23,775 |
| Interquartile 25% (IQ1) | $35,480 | $15,985 |
| Interquartile 75% (IQ3) | $47,466 | $30,233 |
| Interquartile Range (IQR) | $11,986 | $14,248 |
| Standard Deviation (Sample) | $8,108 | $8,932 |
| Standard Deviation (Population) | $8,056 | $8,851 |
Similar Demographics by Per Capita Income
Demographics Similar to Portuguese by Per Capita Income
In terms of per capita income, the demographic groups most similar to Portuguese are Uruguayan ($44,318, a difference of 0.10%), Scottish ($44,440, a difference of 0.18%), Peruvian ($44,479, a difference of 0.26%), Norwegian ($44,480, a difference of 0.27%), and Slovak ($44,229, a difference of 0.30%).
| Demographics | Rating | Rank | Per Capita Income |
| Czechs | 74.1 /100 | #147 | Good $44,595 |
| Immigrants | Armenia | 73.1 /100 | #148 | Good $44,552 |
| Koreans | 72.5 /100 | #149 | Good $44,522 |
| Immigrants | Eritrea | 72.1 /100 | #150 | Good $44,509 |
| Norwegians | 71.5 /100 | #151 | Good $44,480 |
| Peruvians | 71.5 /100 | #152 | Good $44,479 |
| Scottish | 70.6 /100 | #153 | Good $44,440 |
| Portuguese | 68.7 /100 | #154 | Good $44,362 |
| Uruguayans | 67.6 /100 | #155 | Good $44,318 |
| Slovaks | 65.4 /100 | #156 | Good $44,229 |
| South American Indians | 64.8 /100 | #157 | Good $44,206 |
| Immigrants | Nepal | 64.3 /100 | #158 | Good $44,187 |
| South Americans | 62.4 /100 | #159 | Good $44,114 |
| Danes | 61.9 /100 | #160 | Good $44,095 |
| Costa Ricans | 61.8 /100 | #161 | Good $44,090 |
Demographics Similar to Apache by Per Capita Income
In terms of per capita income, the demographic groups most similar to Apache are Immigrants from Cuba ($34,910, a difference of 0.070%), Immigrants from Central America ($34,974, a difference of 0.25%), Kiowa ($35,102, a difference of 0.62%), Menominee ($34,578, a difference of 0.89%), and Mexican ($34,559, a difference of 0.95%).
| Demographics | Rating | Rank | Per Capita Income |
| Hispanics or Latinos | 0.0 /100 | #320 | Tragic $35,688 |
| Blacks/African Americans | 0.0 /100 | #321 | Tragic $35,564 |
| Creek | 0.0 /100 | #322 | Tragic $35,546 |
| Cheyenne | 0.0 /100 | #323 | Tragic $35,276 |
| Kiowa | 0.0 /100 | #324 | Tragic $35,102 |
| Immigrants | Central America | 0.0 /100 | #325 | Tragic $34,974 |
| Immigrants | Cuba | 0.0 /100 | #326 | Tragic $34,910 |
| Apache | 0.0 /100 | #327 | Tragic $34,886 |
| Menominee | 0.0 /100 | #328 | Tragic $34,578 |
| Mexicans | 0.0 /100 | #329 | Tragic $34,559 |
| Spanish American Indians | 0.0 /100 | #330 | Tragic $34,195 |
| Immigrants | Mexico | 0.0 /100 | #331 | Tragic $33,931 |
| Sioux | 0.0 /100 | #332 | Tragic $33,921 |
| Immigrants | Yemen | 0.0 /100 | #333 | Tragic $33,696 |
| Natives/Alaskans | 0.0 /100 | #334 | Tragic $33,279 |