Chickasaw vs Panamanian Per Capita Income
COMPARE
Chickasaw
Panamanian
Per Capita Income
Per Capita Income Comparison
Chickasaw
Panamanians
$36,475
PER CAPITA INCOME
0.0/ 100
METRIC RATING
312th/ 347
METRIC RANK
$42,035
PER CAPITA INCOME
13.9/ 100
METRIC RATING
208th/ 347
METRIC RANK
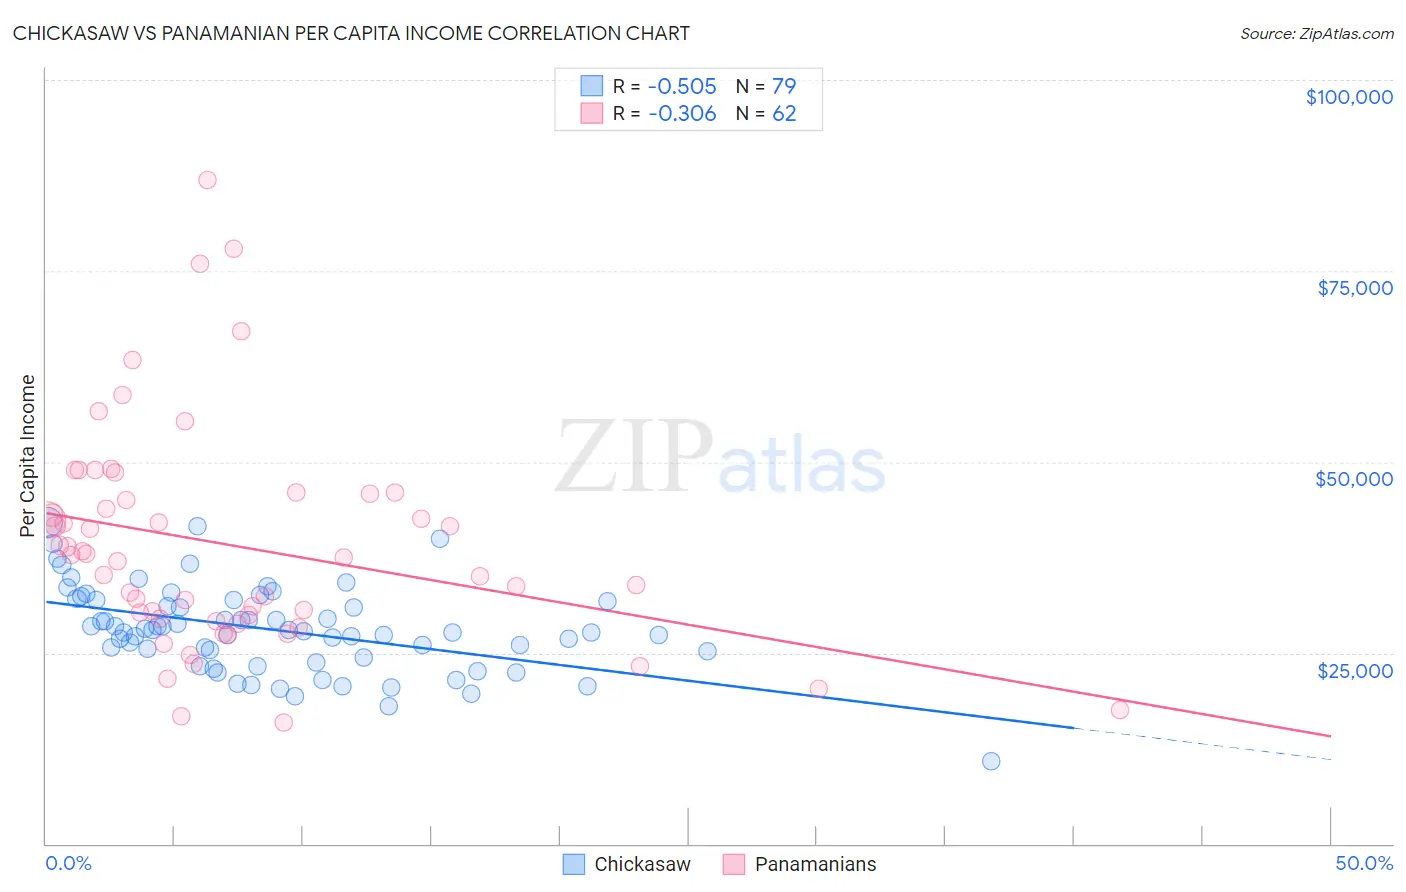
Chickasaw vs Panamanian Per Capita Income Correlation Chart
The statistical analysis conducted on geographies consisting of 147,726,791 people shows a substantial negative correlation between the proportion of Chickasaw and per capita income in the United States with a correlation coefficient (R) of -0.505 and weighted average of $36,475. Similarly, the statistical analysis conducted on geographies consisting of 281,258,630 people shows a mild negative correlation between the proportion of Panamanians and per capita income in the United States with a correlation coefficient (R) of -0.306 and weighted average of $42,035, a difference of 15.2%.
Per Capita Income Correlation Summary
| Measurement | Chickasaw | Panamanian |
| Minimum | $10,758 | $15,844 |
| Maximum | $42,047 | $86,907 |
| Range | $31,289 | $71,063 |
| Mean | $28,009 | $39,085 |
| Median | $27,826 | $37,643 |
| Interquartile 25% (IQ1) | $24,362 | $29,415 |
| Interquartile 75% (IQ3) | $31,977 | $45,746 |
| Interquartile Range (IQR) | $7,616 | $16,331 |
| Standard Deviation (Sample) | $5,659 | $14,450 |
| Standard Deviation (Population) | $5,624 | $14,333 |
Similar Demographics by Per Capita Income
Demographics Similar to Chickasaw by Per Capita Income
In terms of per capita income, the demographic groups most similar to Chickasaw are Bahamian ($36,427, a difference of 0.13%), Chippewa ($36,631, a difference of 0.43%), Ute ($36,651, a difference of 0.48%), Immigrants from Honduras ($36,665, a difference of 0.52%), and Fijian ($36,690, a difference of 0.59%).
| Demographics | Rating | Rank | Per Capita Income |
| Inupiat | 0.1 /100 | #305 | Tragic $36,999 |
| Immigrants | Haiti | 0.0 /100 | #306 | Tragic $36,849 |
| Immigrants | Latin America | 0.0 /100 | #307 | Tragic $36,823 |
| Fijians | 0.0 /100 | #308 | Tragic $36,690 |
| Immigrants | Honduras | 0.0 /100 | #309 | Tragic $36,665 |
| Ute | 0.0 /100 | #310 | Tragic $36,651 |
| Chippewa | 0.0 /100 | #311 | Tragic $36,631 |
| Chickasaw | 0.0 /100 | #312 | Tragic $36,475 |
| Bahamians | 0.0 /100 | #313 | Tragic $36,427 |
| Seminole | 0.0 /100 | #314 | Tragic $36,180 |
| Yaqui | 0.0 /100 | #315 | Tragic $36,112 |
| Choctaw | 0.0 /100 | #316 | Tragic $35,999 |
| Dutch West Indians | 0.0 /100 | #317 | Tragic $35,922 |
| Bangladeshis | 0.0 /100 | #318 | Tragic $35,897 |
| Immigrants | Congo | 0.0 /100 | #319 | Tragic $35,720 |
Demographics Similar to Panamanians by Per Capita Income
In terms of per capita income, the demographic groups most similar to Panamanians are Venezuelan ($42,074, a difference of 0.090%), Immigrants from Sudan ($41,986, a difference of 0.12%), Ecuadorian ($41,958, a difference of 0.18%), Ghanaian ($42,164, a difference of 0.31%), and White/Caucasian ($42,180, a difference of 0.35%).
| Demographics | Rating | Rank | Per Capita Income |
| Immigrants | Thailand | 17.6 /100 | #201 | Poor $42,289 |
| Immigrants | Bosnia and Herzegovina | 17.5 /100 | #202 | Poor $42,278 |
| Spanish | 17.0 /100 | #203 | Poor $42,249 |
| Aleuts | 16.4 /100 | #204 | Poor $42,210 |
| Whites/Caucasians | 15.9 /100 | #205 | Poor $42,180 |
| Ghanaians | 15.7 /100 | #206 | Poor $42,164 |
| Venezuelans | 14.4 /100 | #207 | Poor $42,074 |
| Panamanians | 13.9 /100 | #208 | Poor $42,035 |
| Immigrants | Sudan | 13.2 /100 | #209 | Poor $41,986 |
| Ecuadorians | 12.9 /100 | #210 | Poor $41,958 |
| Immigrants | Panama | 11.6 /100 | #211 | Poor $41,853 |
| Immigrants | Senegal | 11.3 /100 | #212 | Poor $41,830 |
| Immigrants | Venezuela | 10.2 /100 | #213 | Poor $41,727 |
| Immigrants | Bangladesh | 10.1 /100 | #214 | Poor $41,709 |
| Sudanese | 9.9 /100 | #215 | Tragic $41,695 |