Romanian vs Apache Per Capita Income
COMPARE
Romanian
Apache
Per Capita Income
Per Capita Income Comparison
Romanians
Apache
$48,445
PER CAPITA INCOME
99.5/ 100
METRIC RATING
79th/ 347
METRIC RANK
$34,886
PER CAPITA INCOME
0.0/ 100
METRIC RATING
327th/ 347
METRIC RANK
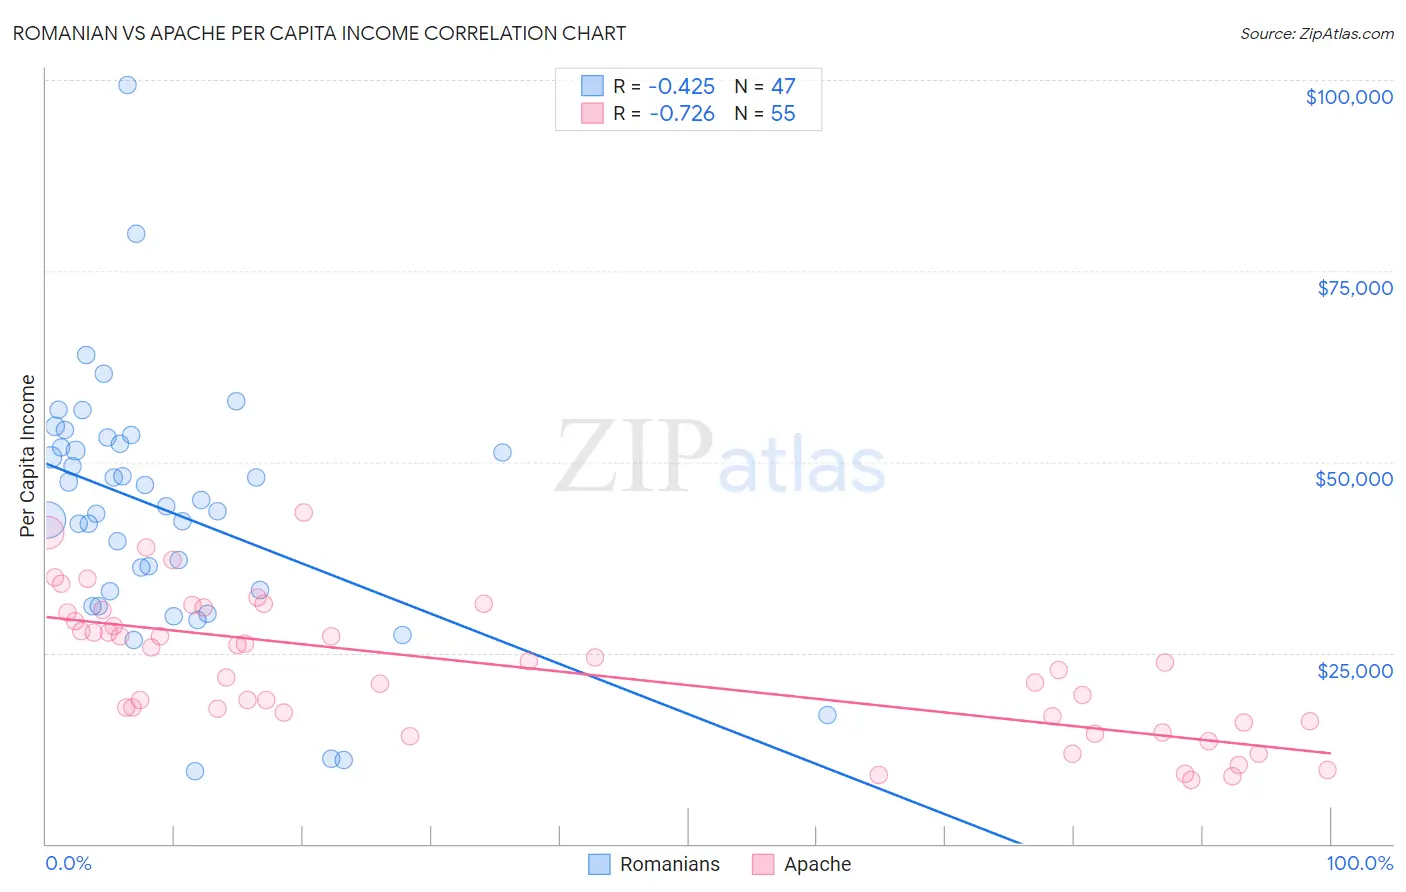
Romanian vs Apache Per Capita Income Correlation Chart
The statistical analysis conducted on geographies consisting of 377,926,432 people shows a moderate negative correlation between the proportion of Romanians and per capita income in the United States with a correlation coefficient (R) of -0.425 and weighted average of $48,445. Similarly, the statistical analysis conducted on geographies consisting of 231,148,099 people shows a strong negative correlation between the proportion of Apache and per capita income in the United States with a correlation coefficient (R) of -0.726 and weighted average of $34,886, a difference of 38.9%.
Per Capita Income Correlation Summary
| Measurement | Romanian | Apache |
| Minimum | $9,471 | $8,398 |
| Maximum | $99,396 | $43,430 |
| Range | $89,925 | $35,032 |
| Mean | $43,633 | $23,117 |
| Median | $44,159 | $23,775 |
| Interquartile 25% (IQ1) | $33,112 | $15,985 |
| Interquartile 75% (IQ3) | $52,383 | $30,233 |
| Interquartile Range (IQR) | $19,271 | $14,248 |
| Standard Deviation (Sample) | $16,424 | $8,932 |
| Standard Deviation (Population) | $16,248 | $8,851 |
Similar Demographics by Per Capita Income
Demographics Similar to Romanians by Per Capita Income
In terms of per capita income, the demographic groups most similar to Romanians are Egyptian ($48,358, a difference of 0.18%), Armenian ($48,287, a difference of 0.33%), Immigrants from Italy ($48,654, a difference of 0.43%), Immigrants from Indonesia ($48,195, a difference of 0.52%), and Immigrants from Brazil ($48,164, a difference of 0.58%).
| Demographics | Rating | Rank | Per Capita Income |
| Immigrants | Hungary | 99.8 /100 | #72 | Exceptional $49,303 |
| Immigrants | North America | 99.8 /100 | #73 | Exceptional $49,302 |
| Mongolians | 99.8 /100 | #74 | Exceptional $49,173 |
| Immigrants | Bolivia | 99.7 /100 | #75 | Exceptional $48,970 |
| Immigrants | England | 99.7 /100 | #76 | Exceptional $48,844 |
| Immigrants | Kazakhstan | 99.7 /100 | #77 | Exceptional $48,747 |
| Immigrants | Italy | 99.6 /100 | #78 | Exceptional $48,654 |
| Romanians | 99.5 /100 | #79 | Exceptional $48,445 |
| Egyptians | 99.5 /100 | #80 | Exceptional $48,358 |
| Armenians | 99.4 /100 | #81 | Exceptional $48,287 |
| Immigrants | Indonesia | 99.4 /100 | #82 | Exceptional $48,195 |
| Immigrants | Brazil | 99.4 /100 | #83 | Exceptional $48,164 |
| Immigrants | Ukraine | 99.3 /100 | #84 | Exceptional $48,134 |
| Austrians | 99.3 /100 | #85 | Exceptional $48,116 |
| Immigrants | Southern Europe | 99.3 /100 | #86 | Exceptional $48,027 |
Demographics Similar to Apache by Per Capita Income
In terms of per capita income, the demographic groups most similar to Apache are Immigrants from Cuba ($34,910, a difference of 0.070%), Immigrants from Central America ($34,974, a difference of 0.25%), Kiowa ($35,102, a difference of 0.62%), Menominee ($34,578, a difference of 0.89%), and Mexican ($34,559, a difference of 0.95%).
| Demographics | Rating | Rank | Per Capita Income |
| Hispanics or Latinos | 0.0 /100 | #320 | Tragic $35,688 |
| Blacks/African Americans | 0.0 /100 | #321 | Tragic $35,564 |
| Creek | 0.0 /100 | #322 | Tragic $35,546 |
| Cheyenne | 0.0 /100 | #323 | Tragic $35,276 |
| Kiowa | 0.0 /100 | #324 | Tragic $35,102 |
| Immigrants | Central America | 0.0 /100 | #325 | Tragic $34,974 |
| Immigrants | Cuba | 0.0 /100 | #326 | Tragic $34,910 |
| Apache | 0.0 /100 | #327 | Tragic $34,886 |
| Menominee | 0.0 /100 | #328 | Tragic $34,578 |
| Mexicans | 0.0 /100 | #329 | Tragic $34,559 |
| Spanish American Indians | 0.0 /100 | #330 | Tragic $34,195 |
| Immigrants | Mexico | 0.0 /100 | #331 | Tragic $33,931 |
| Sioux | 0.0 /100 | #332 | Tragic $33,921 |
| Immigrants | Yemen | 0.0 /100 | #333 | Tragic $33,696 |
| Natives/Alaskans | 0.0 /100 | #334 | Tragic $33,279 |