Ottawa vs Apache Per Capita Income
COMPARE
Ottawa
Apache
Per Capita Income
Per Capita Income Comparison
Ottawa
Apache
$37,101
PER CAPITA INCOME
0.1/ 100
METRIC RATING
301st/ 347
METRIC RANK
$34,886
PER CAPITA INCOME
0.0/ 100
METRIC RATING
327th/ 347
METRIC RANK
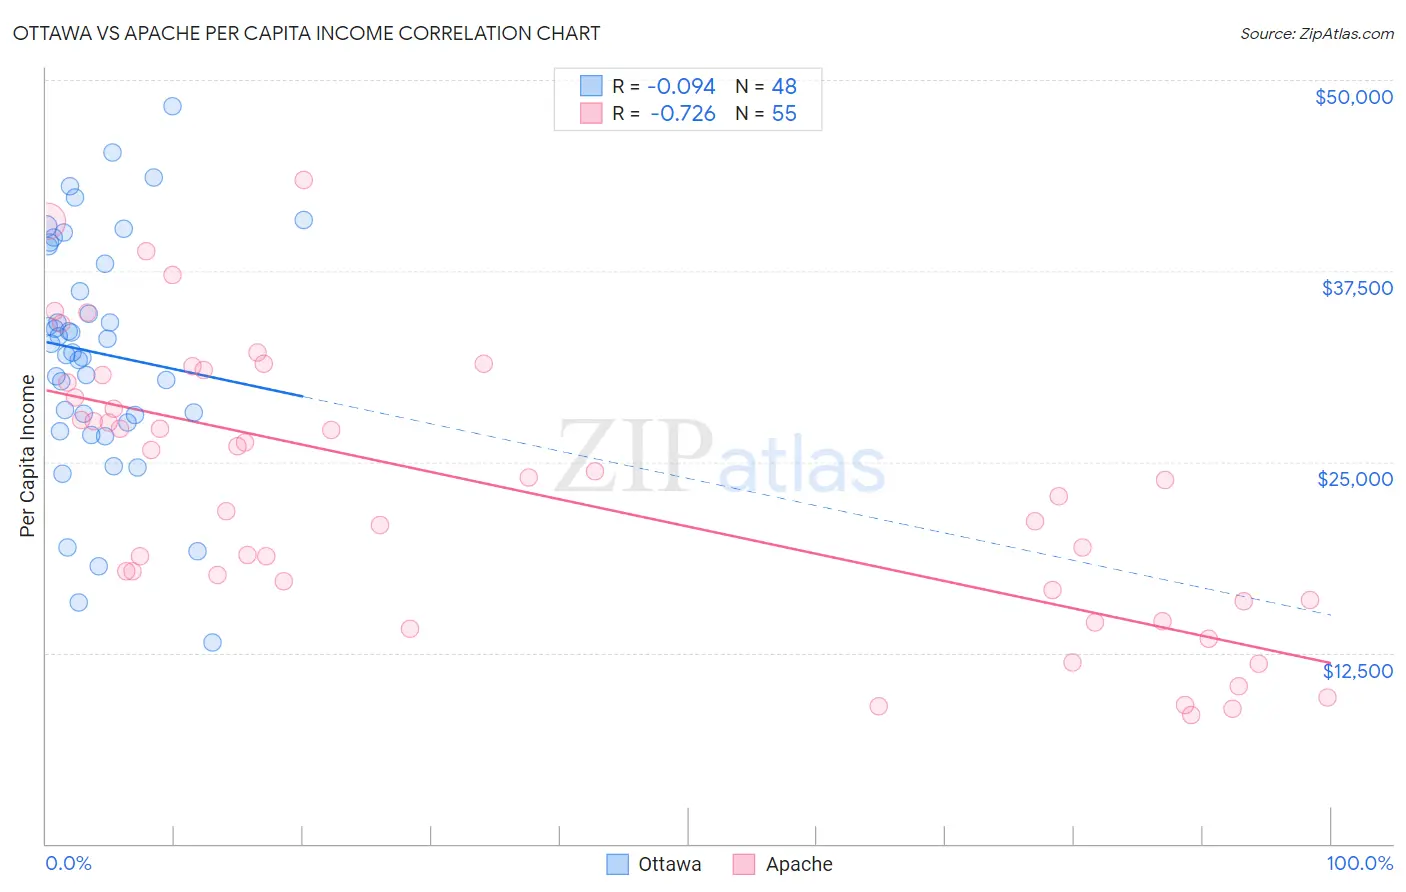
Ottawa vs Apache Per Capita Income Correlation Chart
The statistical analysis conducted on geographies consisting of 49,956,726 people shows a slight negative correlation between the proportion of Ottawa and per capita income in the United States with a correlation coefficient (R) of -0.094 and weighted average of $37,101. Similarly, the statistical analysis conducted on geographies consisting of 231,148,099 people shows a strong negative correlation between the proportion of Apache and per capita income in the United States with a correlation coefficient (R) of -0.726 and weighted average of $34,886, a difference of 6.4%.
Per Capita Income Correlation Summary
| Measurement | Ottawa | Apache |
| Minimum | $13,161 | $8,398 |
| Maximum | $48,274 | $43,430 |
| Range | $35,113 | $35,032 |
| Mean | $32,137 | $23,117 |
| Median | $32,448 | $23,775 |
| Interquartile 25% (IQ1) | $27,814 | $15,985 |
| Interquartile 75% (IQ3) | $38,554 | $30,233 |
| Interquartile Range (IQR) | $10,740 | $14,248 |
| Standard Deviation (Sample) | $7,713 | $8,932 |
| Standard Deviation (Population) | $7,632 | $8,851 |
Similar Demographics by Per Capita Income
Demographics Similar to Ottawa by Per Capita Income
In terms of per capita income, the demographic groups most similar to Ottawa are Shoshone ($37,072, a difference of 0.080%), Paiute ($37,066, a difference of 0.10%), Honduran ($37,031, a difference of 0.19%), Immigrants from Bahamas ($37,193, a difference of 0.25%), and Cherokee ($37,203, a difference of 0.27%).
| Demographics | Rating | Rank | Per Capita Income |
| Cubans | 0.1 /100 | #294 | Tragic $37,383 |
| Immigrants | Dominican Republic | 0.1 /100 | #295 | Tragic $37,306 |
| Indonesians | 0.1 /100 | #296 | Tragic $37,300 |
| Haitians | 0.1 /100 | #297 | Tragic $37,289 |
| Immigrants | Caribbean | 0.1 /100 | #298 | Tragic $37,254 |
| Cherokee | 0.1 /100 | #299 | Tragic $37,203 |
| Immigrants | Bahamas | 0.1 /100 | #300 | Tragic $37,193 |
| Ottawa | 0.1 /100 | #301 | Tragic $37,101 |
| Shoshone | 0.1 /100 | #302 | Tragic $37,072 |
| Paiute | 0.1 /100 | #303 | Tragic $37,066 |
| Hondurans | 0.1 /100 | #304 | Tragic $37,031 |
| Inupiat | 0.1 /100 | #305 | Tragic $36,999 |
| Immigrants | Haiti | 0.0 /100 | #306 | Tragic $36,849 |
| Immigrants | Latin America | 0.0 /100 | #307 | Tragic $36,823 |
| Fijians | 0.0 /100 | #308 | Tragic $36,690 |
Demographics Similar to Apache by Per Capita Income
In terms of per capita income, the demographic groups most similar to Apache are Immigrants from Cuba ($34,910, a difference of 0.070%), Immigrants from Central America ($34,974, a difference of 0.25%), Kiowa ($35,102, a difference of 0.62%), Menominee ($34,578, a difference of 0.89%), and Mexican ($34,559, a difference of 0.95%).
| Demographics | Rating | Rank | Per Capita Income |
| Hispanics or Latinos | 0.0 /100 | #320 | Tragic $35,688 |
| Blacks/African Americans | 0.0 /100 | #321 | Tragic $35,564 |
| Creek | 0.0 /100 | #322 | Tragic $35,546 |
| Cheyenne | 0.0 /100 | #323 | Tragic $35,276 |
| Kiowa | 0.0 /100 | #324 | Tragic $35,102 |
| Immigrants | Central America | 0.0 /100 | #325 | Tragic $34,974 |
| Immigrants | Cuba | 0.0 /100 | #326 | Tragic $34,910 |
| Apache | 0.0 /100 | #327 | Tragic $34,886 |
| Menominee | 0.0 /100 | #328 | Tragic $34,578 |
| Mexicans | 0.0 /100 | #329 | Tragic $34,559 |
| Spanish American Indians | 0.0 /100 | #330 | Tragic $34,195 |
| Immigrants | Mexico | 0.0 /100 | #331 | Tragic $33,931 |
| Sioux | 0.0 /100 | #332 | Tragic $33,921 |
| Immigrants | Yemen | 0.0 /100 | #333 | Tragic $33,696 |
| Natives/Alaskans | 0.0 /100 | #334 | Tragic $33,279 |