Chickasaw vs Bulgarian Per Capita Income
COMPARE
Chickasaw
Bulgarian
Per Capita Income
Per Capita Income Comparison
Chickasaw
Bulgarians
$36,475
PER CAPITA INCOME
0.0/ 100
METRIC RATING
312th/ 347
METRIC RANK
$50,906
PER CAPITA INCOME
100.0/ 100
METRIC RATING
47th/ 347
METRIC RANK
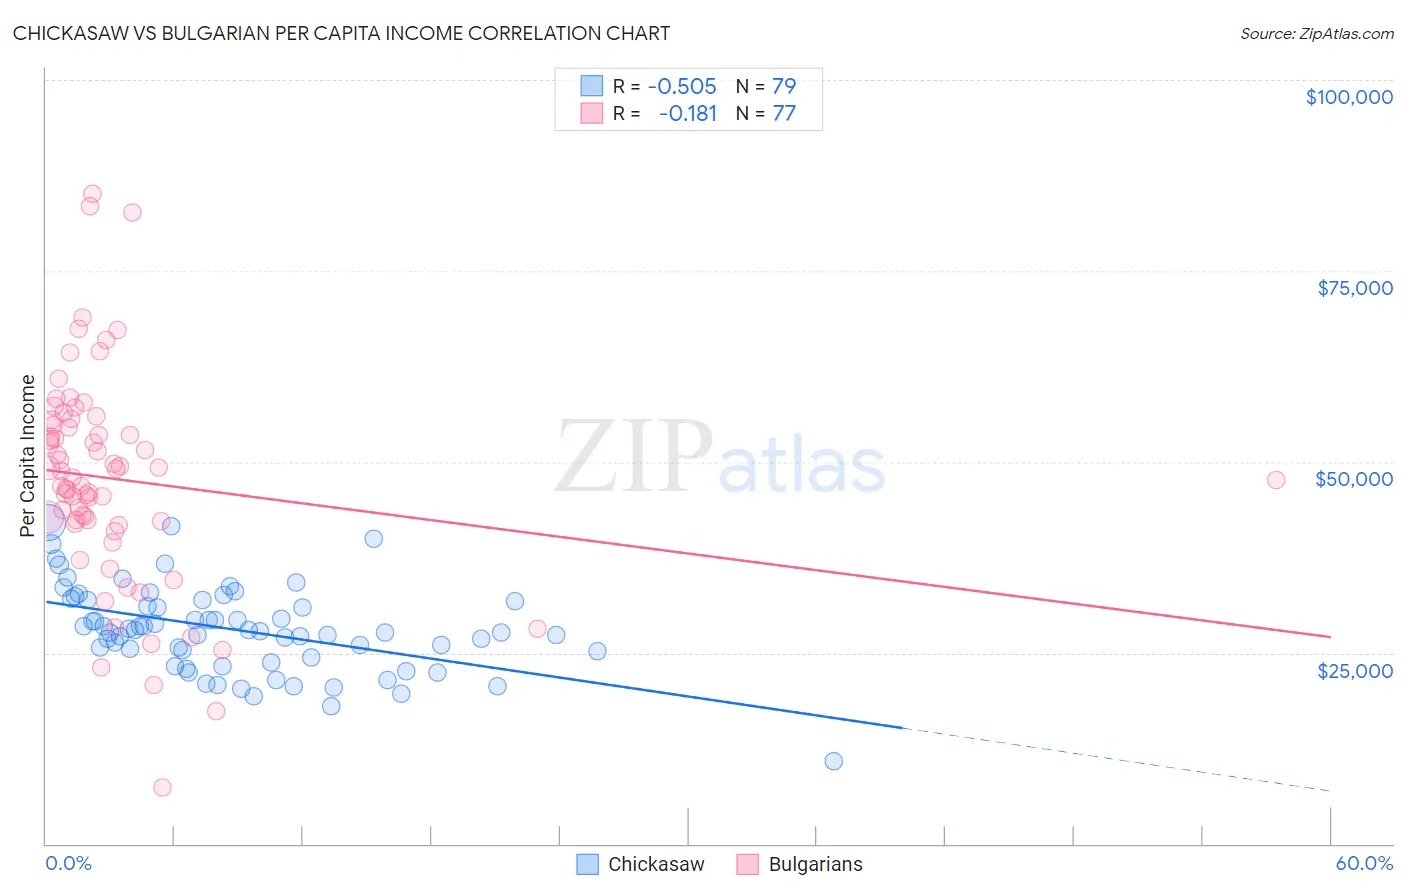
Chickasaw vs Bulgarian Per Capita Income Correlation Chart
The statistical analysis conducted on geographies consisting of 147,726,791 people shows a substantial negative correlation between the proportion of Chickasaw and per capita income in the United States with a correlation coefficient (R) of -0.505 and weighted average of $36,475. Similarly, the statistical analysis conducted on geographies consisting of 205,631,200 people shows a poor negative correlation between the proportion of Bulgarians and per capita income in the United States with a correlation coefficient (R) of -0.181 and weighted average of $50,906, a difference of 39.6%.
Per Capita Income Correlation Summary
| Measurement | Chickasaw | Bulgarian |
| Minimum | $10,758 | $7,295 |
| Maximum | $42,047 | $85,161 |
| Range | $31,289 | $77,866 |
| Mean | $28,009 | $47,737 |
| Median | $27,826 | $47,962 |
| Interquartile 25% (IQ1) | $24,362 | $42,061 |
| Interquartile 75% (IQ3) | $31,977 | $55,182 |
| Interquartile Range (IQR) | $7,616 | $13,122 |
| Standard Deviation (Sample) | $5,659 | $13,985 |
| Standard Deviation (Population) | $5,624 | $13,894 |
Similar Demographics by Per Capita Income
Demographics Similar to Chickasaw by Per Capita Income
In terms of per capita income, the demographic groups most similar to Chickasaw are Bahamian ($36,427, a difference of 0.13%), Chippewa ($36,631, a difference of 0.43%), Ute ($36,651, a difference of 0.48%), Immigrants from Honduras ($36,665, a difference of 0.52%), and Fijian ($36,690, a difference of 0.59%).
| Demographics | Rating | Rank | Per Capita Income |
| Inupiat | 0.1 /100 | #305 | Tragic $36,999 |
| Immigrants | Haiti | 0.0 /100 | #306 | Tragic $36,849 |
| Immigrants | Latin America | 0.0 /100 | #307 | Tragic $36,823 |
| Fijians | 0.0 /100 | #308 | Tragic $36,690 |
| Immigrants | Honduras | 0.0 /100 | #309 | Tragic $36,665 |
| Ute | 0.0 /100 | #310 | Tragic $36,651 |
| Chippewa | 0.0 /100 | #311 | Tragic $36,631 |
| Chickasaw | 0.0 /100 | #312 | Tragic $36,475 |
| Bahamians | 0.0 /100 | #313 | Tragic $36,427 |
| Seminole | 0.0 /100 | #314 | Tragic $36,180 |
| Yaqui | 0.0 /100 | #315 | Tragic $36,112 |
| Choctaw | 0.0 /100 | #316 | Tragic $35,999 |
| Dutch West Indians | 0.0 /100 | #317 | Tragic $35,922 |
| Bangladeshis | 0.0 /100 | #318 | Tragic $35,897 |
| Immigrants | Congo | 0.0 /100 | #319 | Tragic $35,720 |
Demographics Similar to Bulgarians by Per Capita Income
In terms of per capita income, the demographic groups most similar to Bulgarians are Immigrants from Latvia ($50,914, a difference of 0.020%), Immigrants from Spain ($50,933, a difference of 0.050%), Immigrants from Europe ($50,950, a difference of 0.090%), Immigrants from Serbia ($50,810, a difference of 0.19%), and New Zealander ($50,575, a difference of 0.65%).
| Demographics | Rating | Rank | Per Capita Income |
| Immigrants | Korea | 100.0 /100 | #40 | Exceptional $51,671 |
| Immigrants | South Africa | 100.0 /100 | #41 | Exceptional $51,465 |
| Immigrants | Turkey | 100.0 /100 | #42 | Exceptional $51,368 |
| Immigrants | Lithuania | 100.0 /100 | #43 | Exceptional $51,361 |
| Immigrants | Europe | 100.0 /100 | #44 | Exceptional $50,950 |
| Immigrants | Spain | 100.0 /100 | #45 | Exceptional $50,933 |
| Immigrants | Latvia | 100.0 /100 | #46 | Exceptional $50,914 |
| Bulgarians | 100.0 /100 | #47 | Exceptional $50,906 |
| Immigrants | Serbia | 100.0 /100 | #48 | Exceptional $50,810 |
| New Zealanders | 100.0 /100 | #49 | Exceptional $50,575 |
| Immigrants | Sri Lanka | 100.0 /100 | #50 | Exceptional $50,555 |
| Immigrants | Netherlands | 100.0 /100 | #51 | Exceptional $50,458 |
| Immigrants | Croatia | 99.9 /100 | #52 | Exceptional $50,417 |
| Paraguayans | 99.9 /100 | #53 | Exceptional $50,385 |
| Immigrants | Belarus | 99.9 /100 | #54 | Exceptional $50,303 |