Chickasaw vs Immigrants from Yemen Per Capita Income
COMPARE
Chickasaw
Immigrants from Yemen
Per Capita Income
Per Capita Income Comparison
Chickasaw
Immigrants from Yemen
$36,475
PER CAPITA INCOME
0.0/ 100
METRIC RATING
312th/ 347
METRIC RANK
$33,696
PER CAPITA INCOME
0.0/ 100
METRIC RATING
333rd/ 347
METRIC RANK
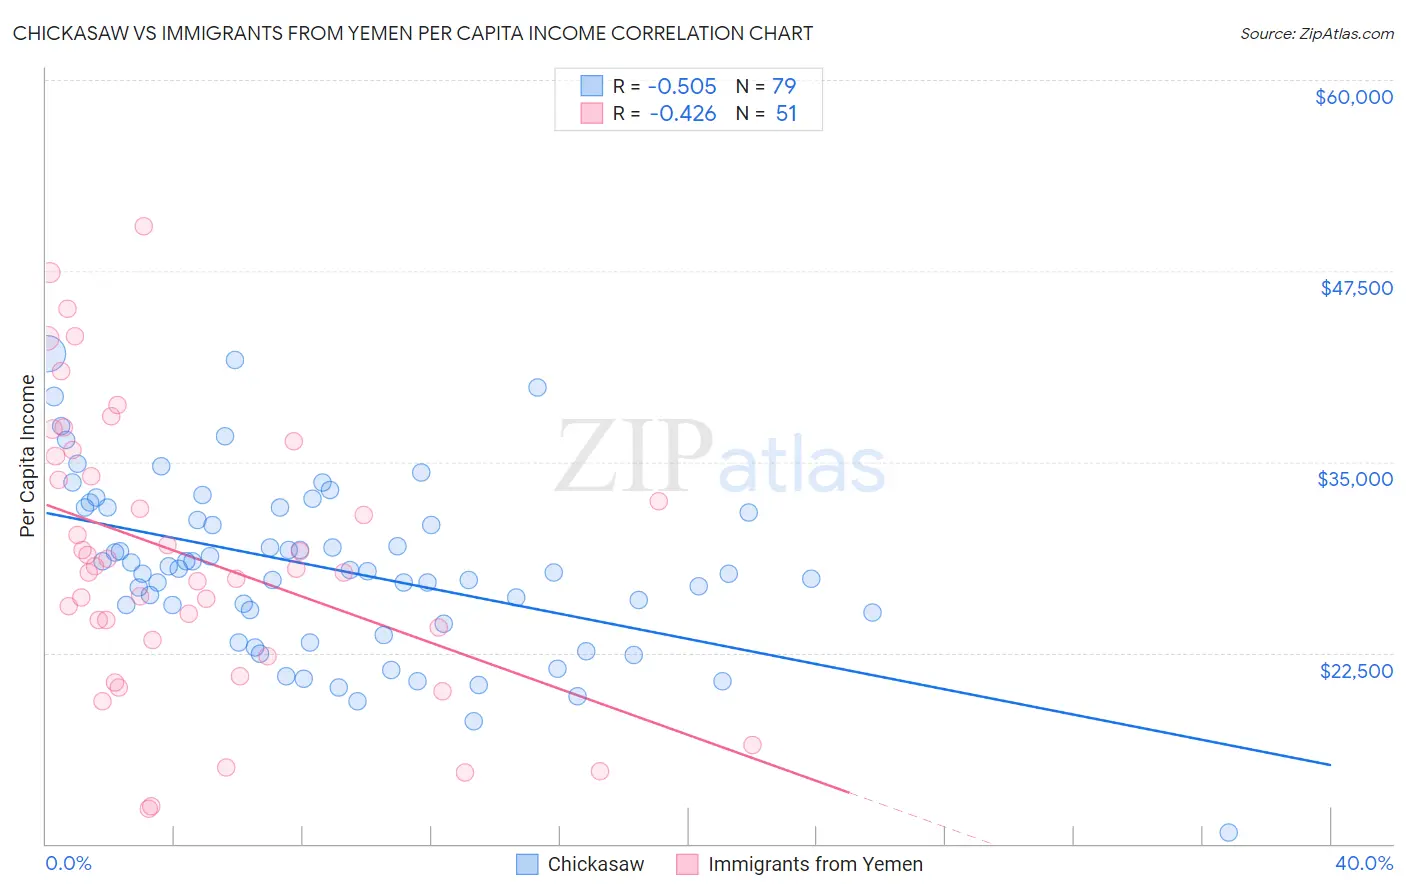
Chickasaw vs Immigrants from Yemen Per Capita Income Correlation Chart
The statistical analysis conducted on geographies consisting of 147,726,791 people shows a substantial negative correlation between the proportion of Chickasaw and per capita income in the United States with a correlation coefficient (R) of -0.505 and weighted average of $36,475. Similarly, the statistical analysis conducted on geographies consisting of 82,433,611 people shows a moderate negative correlation between the proportion of Immigrants from Yemen and per capita income in the United States with a correlation coefficient (R) of -0.426 and weighted average of $33,696, a difference of 8.3%.
Per Capita Income Correlation Summary
| Measurement | Chickasaw | Immigrants from Yemen |
| Minimum | $10,758 | $12,331 |
| Maximum | $42,047 | $50,453 |
| Range | $31,289 | $38,122 |
| Mean | $28,009 | $28,807 |
| Median | $27,826 | $28,035 |
| Interquartile 25% (IQ1) | $24,362 | $23,368 |
| Interquartile 75% (IQ3) | $31,977 | $35,374 |
| Interquartile Range (IQR) | $7,616 | $12,006 |
| Standard Deviation (Sample) | $5,659 | $8,972 |
| Standard Deviation (Population) | $5,624 | $8,883 |
Similar Demographics by Per Capita Income
Demographics Similar to Chickasaw by Per Capita Income
In terms of per capita income, the demographic groups most similar to Chickasaw are Bahamian ($36,427, a difference of 0.13%), Chippewa ($36,631, a difference of 0.43%), Ute ($36,651, a difference of 0.48%), Immigrants from Honduras ($36,665, a difference of 0.52%), and Fijian ($36,690, a difference of 0.59%).
| Demographics | Rating | Rank | Per Capita Income |
| Inupiat | 0.1 /100 | #305 | Tragic $36,999 |
| Immigrants | Haiti | 0.0 /100 | #306 | Tragic $36,849 |
| Immigrants | Latin America | 0.0 /100 | #307 | Tragic $36,823 |
| Fijians | 0.0 /100 | #308 | Tragic $36,690 |
| Immigrants | Honduras | 0.0 /100 | #309 | Tragic $36,665 |
| Ute | 0.0 /100 | #310 | Tragic $36,651 |
| Chippewa | 0.0 /100 | #311 | Tragic $36,631 |
| Chickasaw | 0.0 /100 | #312 | Tragic $36,475 |
| Bahamians | 0.0 /100 | #313 | Tragic $36,427 |
| Seminole | 0.0 /100 | #314 | Tragic $36,180 |
| Yaqui | 0.0 /100 | #315 | Tragic $36,112 |
| Choctaw | 0.0 /100 | #316 | Tragic $35,999 |
| Dutch West Indians | 0.0 /100 | #317 | Tragic $35,922 |
| Bangladeshis | 0.0 /100 | #318 | Tragic $35,897 |
| Immigrants | Congo | 0.0 /100 | #319 | Tragic $35,720 |
Demographics Similar to Immigrants from Yemen by Per Capita Income
In terms of per capita income, the demographic groups most similar to Immigrants from Yemen are Sioux ($33,921, a difference of 0.67%), Immigrants from Mexico ($33,931, a difference of 0.70%), Native/Alaskan ($33,279, a difference of 1.3%), Yuman ($33,236, a difference of 1.4%), and Spanish American Indian ($34,195, a difference of 1.5%).
| Demographics | Rating | Rank | Per Capita Income |
| Immigrants | Cuba | 0.0 /100 | #326 | Tragic $34,910 |
| Apache | 0.0 /100 | #327 | Tragic $34,886 |
| Menominee | 0.0 /100 | #328 | Tragic $34,578 |
| Mexicans | 0.0 /100 | #329 | Tragic $34,559 |
| Spanish American Indians | 0.0 /100 | #330 | Tragic $34,195 |
| Immigrants | Mexico | 0.0 /100 | #331 | Tragic $33,931 |
| Sioux | 0.0 /100 | #332 | Tragic $33,921 |
| Immigrants | Yemen | 0.0 /100 | #333 | Tragic $33,696 |
| Natives/Alaskans | 0.0 /100 | #334 | Tragic $33,279 |
| Yuman | 0.0 /100 | #335 | Tragic $33,236 |
| Yakama | 0.0 /100 | #336 | Tragic $33,009 |
| Houma | 0.0 /100 | #337 | Tragic $32,996 |
| Arapaho | 0.0 /100 | #338 | Tragic $32,345 |
| Pueblo | 0.0 /100 | #339 | Tragic $32,012 |
| Crow | 0.0 /100 | #340 | Tragic $31,729 |