Danish vs Apache Per Capita Income
COMPARE
Danish
Apache
Per Capita Income
Per Capita Income Comparison
Danes
Apache
$44,095
PER CAPITA INCOME
61.9/ 100
METRIC RATING
160th/ 347
METRIC RANK
$34,886
PER CAPITA INCOME
0.0/ 100
METRIC RATING
327th/ 347
METRIC RANK
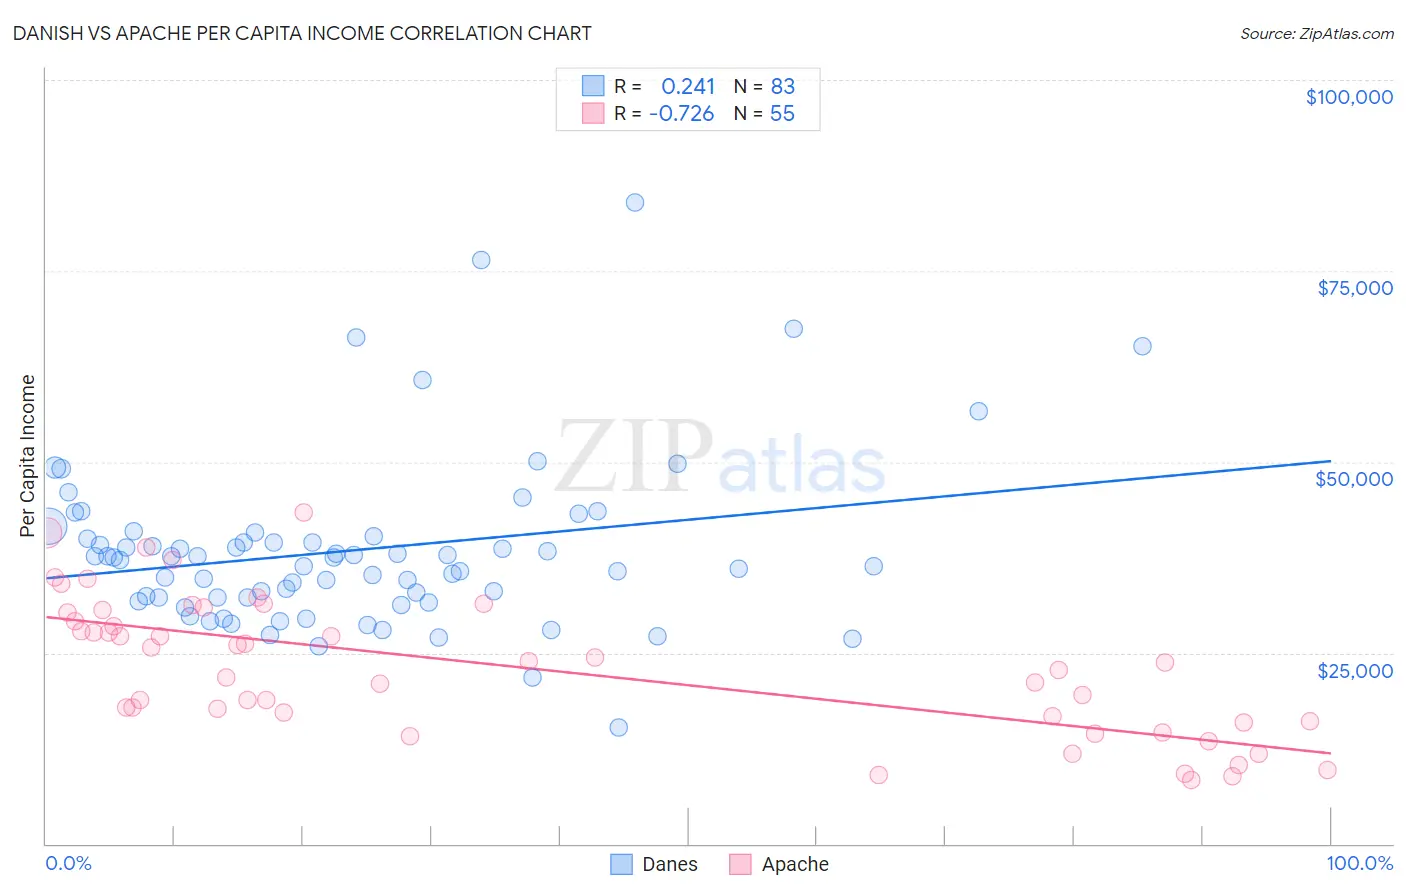
Danish vs Apache Per Capita Income Correlation Chart
The statistical analysis conducted on geographies consisting of 474,208,442 people shows a weak positive correlation between the proportion of Danes and per capita income in the United States with a correlation coefficient (R) of 0.241 and weighted average of $44,095. Similarly, the statistical analysis conducted on geographies consisting of 231,148,099 people shows a strong negative correlation between the proportion of Apache and per capita income in the United States with a correlation coefficient (R) of -0.726 and weighted average of $34,886, a difference of 26.4%.
Per Capita Income Correlation Summary
| Measurement | Danish | Apache |
| Minimum | $15,232 | $8,398 |
| Maximum | $83,892 | $43,430 |
| Range | $68,660 | $35,032 |
| Mean | $38,430 | $23,117 |
| Median | $37,481 | $23,775 |
| Interquartile 25% (IQ1) | $32,272 | $15,985 |
| Interquartile 75% (IQ3) | $40,294 | $30,233 |
| Interquartile Range (IQR) | $8,022 | $14,248 |
| Standard Deviation (Sample) | $11,196 | $8,932 |
| Standard Deviation (Population) | $11,128 | $8,851 |
Similar Demographics by Per Capita Income
Demographics Similar to Danes by Per Capita Income
In terms of per capita income, the demographic groups most similar to Danes are Costa Rican ($44,090, a difference of 0.010%), South American ($44,114, a difference of 0.040%), Swiss ($44,076, a difference of 0.040%), Immigrants from South America ($44,068, a difference of 0.060%), and Sri Lankan ($44,014, a difference of 0.18%).
| Demographics | Rating | Rank | Per Capita Income |
| Scottish | 70.6 /100 | #153 | Good $44,440 |
| Portuguese | 68.7 /100 | #154 | Good $44,362 |
| Uruguayans | 67.6 /100 | #155 | Good $44,318 |
| Slovaks | 65.4 /100 | #156 | Good $44,229 |
| South American Indians | 64.8 /100 | #157 | Good $44,206 |
| Immigrants | Nepal | 64.3 /100 | #158 | Good $44,187 |
| South Americans | 62.4 /100 | #159 | Good $44,114 |
| Danes | 61.9 /100 | #160 | Good $44,095 |
| Costa Ricans | 61.8 /100 | #161 | Good $44,090 |
| Swiss | 61.4 /100 | #162 | Good $44,076 |
| Immigrants | South America | 61.2 /100 | #163 | Good $44,068 |
| Sri Lankans | 59.8 /100 | #164 | Average $44,014 |
| Immigrants | Philippines | 59.4 /100 | #165 | Average $44,000 |
| Immigrants | Uruguay | 59.3 /100 | #166 | Average $43,997 |
| English | 58.9 /100 | #167 | Average $43,982 |
Demographics Similar to Apache by Per Capita Income
In terms of per capita income, the demographic groups most similar to Apache are Immigrants from Cuba ($34,910, a difference of 0.070%), Immigrants from Central America ($34,974, a difference of 0.25%), Kiowa ($35,102, a difference of 0.62%), Menominee ($34,578, a difference of 0.89%), and Mexican ($34,559, a difference of 0.95%).
| Demographics | Rating | Rank | Per Capita Income |
| Hispanics or Latinos | 0.0 /100 | #320 | Tragic $35,688 |
| Blacks/African Americans | 0.0 /100 | #321 | Tragic $35,564 |
| Creek | 0.0 /100 | #322 | Tragic $35,546 |
| Cheyenne | 0.0 /100 | #323 | Tragic $35,276 |
| Kiowa | 0.0 /100 | #324 | Tragic $35,102 |
| Immigrants | Central America | 0.0 /100 | #325 | Tragic $34,974 |
| Immigrants | Cuba | 0.0 /100 | #326 | Tragic $34,910 |
| Apache | 0.0 /100 | #327 | Tragic $34,886 |
| Menominee | 0.0 /100 | #328 | Tragic $34,578 |
| Mexicans | 0.0 /100 | #329 | Tragic $34,559 |
| Spanish American Indians | 0.0 /100 | #330 | Tragic $34,195 |
| Immigrants | Mexico | 0.0 /100 | #331 | Tragic $33,931 |
| Sioux | 0.0 /100 | #332 | Tragic $33,921 |
| Immigrants | Yemen | 0.0 /100 | #333 | Tragic $33,696 |
| Natives/Alaskans | 0.0 /100 | #334 | Tragic $33,279 |