Israeli vs Apache Per Capita Income
COMPARE
Israeli
Apache
Per Capita Income
Per Capita Income Comparison
Israelis
Apache
$52,596
PER CAPITA INCOME
100.0/ 100
METRIC RATING
29th/ 347
METRIC RANK
$34,886
PER CAPITA INCOME
0.0/ 100
METRIC RATING
327th/ 347
METRIC RANK
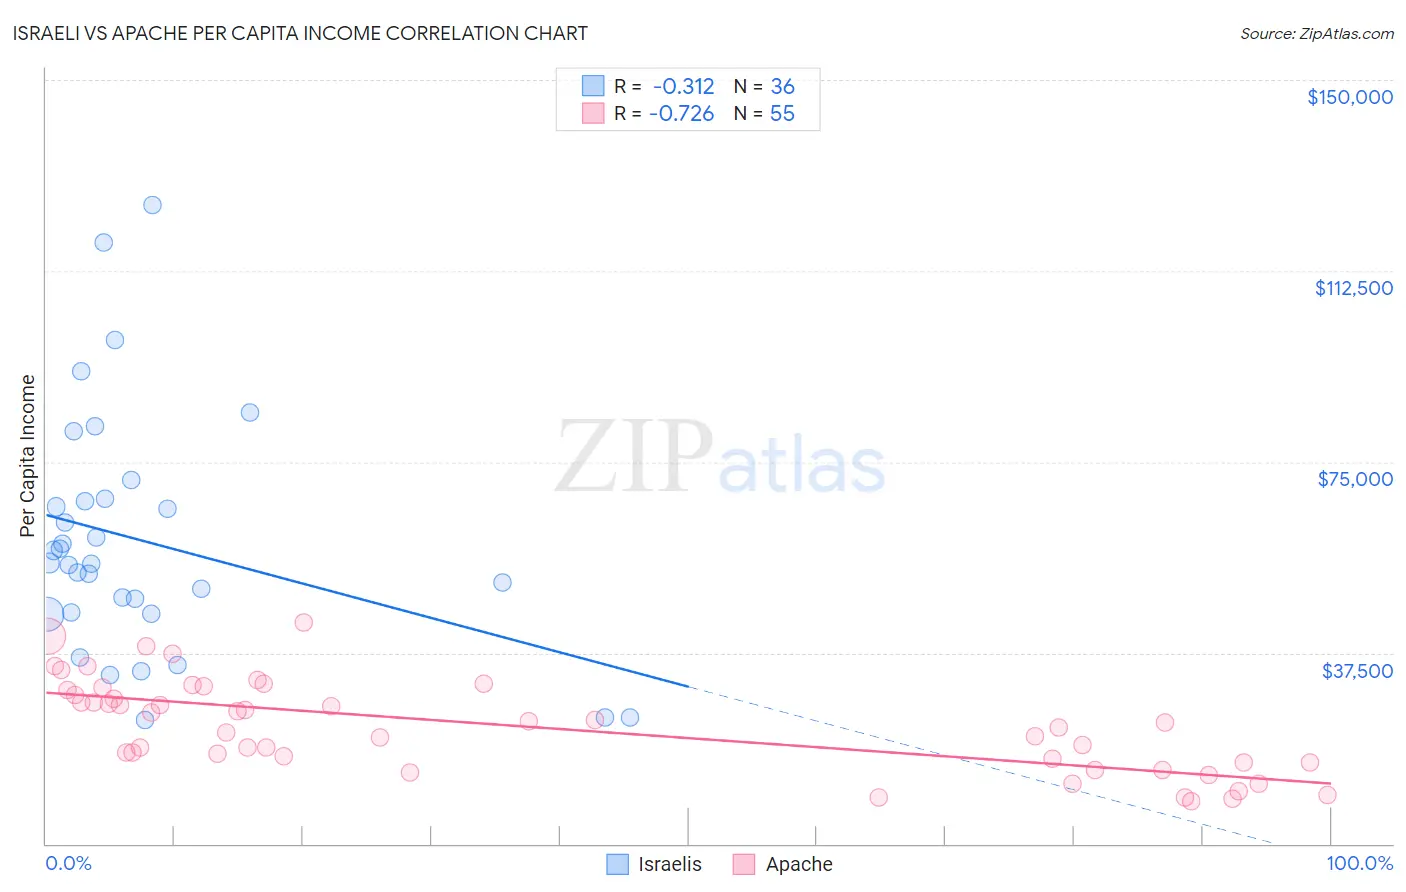
Israeli vs Apache Per Capita Income Correlation Chart
The statistical analysis conducted on geographies consisting of 211,224,844 people shows a mild negative correlation between the proportion of Israelis and per capita income in the United States with a correlation coefficient (R) of -0.312 and weighted average of $52,596. Similarly, the statistical analysis conducted on geographies consisting of 231,148,099 people shows a strong negative correlation between the proportion of Apache and per capita income in the United States with a correlation coefficient (R) of -0.726 and weighted average of $34,886, a difference of 50.8%.
Per Capita Income Correlation Summary
| Measurement | Israeli | Apache |
| Minimum | $24,292 | $8,398 |
| Maximum | $125,412 | $43,430 |
| Range | $101,120 | $35,032 |
| Mean | $59,345 | $23,117 |
| Median | $55,064 | $23,775 |
| Interquartile 25% (IQ1) | $45,317 | $15,985 |
| Interquartile 75% (IQ3) | $67,525 | $30,233 |
| Interquartile Range (IQR) | $22,208 | $14,248 |
| Standard Deviation (Sample) | $23,722 | $8,932 |
| Standard Deviation (Population) | $23,390 | $8,851 |
Similar Demographics by Per Capita Income
Demographics Similar to Israelis by Per Capita Income
In terms of per capita income, the demographic groups most similar to Israelis are Latvian ($52,649, a difference of 0.10%), Immigrants from South Central Asia ($52,660, a difference of 0.12%), Immigrants from Austria ($52,503, a difference of 0.18%), Turkish ($52,391, a difference of 0.39%), and Immigrants from Norway ($52,217, a difference of 0.73%).
| Demographics | Rating | Rank | Per Capita Income |
| Indians (Asian) | 100.0 /100 | #22 | Exceptional $53,874 |
| Immigrants | Eastern Asia | 100.0 /100 | #23 | Exceptional $53,806 |
| Immigrants | Denmark | 100.0 /100 | #24 | Exceptional $53,799 |
| Immigrants | Japan | 100.0 /100 | #25 | Exceptional $53,359 |
| Russians | 100.0 /100 | #26 | Exceptional $53,154 |
| Immigrants | South Central Asia | 100.0 /100 | #27 | Exceptional $52,660 |
| Latvians | 100.0 /100 | #28 | Exceptional $52,649 |
| Israelis | 100.0 /100 | #29 | Exceptional $52,596 |
| Immigrants | Austria | 100.0 /100 | #30 | Exceptional $52,503 |
| Turks | 100.0 /100 | #31 | Exceptional $52,391 |
| Immigrants | Norway | 100.0 /100 | #32 | Exceptional $52,217 |
| Australians | 100.0 /100 | #33 | Exceptional $52,074 |
| Immigrants | Russia | 100.0 /100 | #34 | Exceptional $52,044 |
| Burmese | 100.0 /100 | #35 | Exceptional $52,005 |
| Immigrants | Greece | 100.0 /100 | #36 | Exceptional $51,891 |
Demographics Similar to Apache by Per Capita Income
In terms of per capita income, the demographic groups most similar to Apache are Immigrants from Cuba ($34,910, a difference of 0.070%), Immigrants from Central America ($34,974, a difference of 0.25%), Kiowa ($35,102, a difference of 0.62%), Menominee ($34,578, a difference of 0.89%), and Mexican ($34,559, a difference of 0.95%).
| Demographics | Rating | Rank | Per Capita Income |
| Hispanics or Latinos | 0.0 /100 | #320 | Tragic $35,688 |
| Blacks/African Americans | 0.0 /100 | #321 | Tragic $35,564 |
| Creek | 0.0 /100 | #322 | Tragic $35,546 |
| Cheyenne | 0.0 /100 | #323 | Tragic $35,276 |
| Kiowa | 0.0 /100 | #324 | Tragic $35,102 |
| Immigrants | Central America | 0.0 /100 | #325 | Tragic $34,974 |
| Immigrants | Cuba | 0.0 /100 | #326 | Tragic $34,910 |
| Apache | 0.0 /100 | #327 | Tragic $34,886 |
| Menominee | 0.0 /100 | #328 | Tragic $34,578 |
| Mexicans | 0.0 /100 | #329 | Tragic $34,559 |
| Spanish American Indians | 0.0 /100 | #330 | Tragic $34,195 |
| Immigrants | Mexico | 0.0 /100 | #331 | Tragic $33,931 |
| Sioux | 0.0 /100 | #332 | Tragic $33,921 |
| Immigrants | Yemen | 0.0 /100 | #333 | Tragic $33,696 |
| Natives/Alaskans | 0.0 /100 | #334 | Tragic $33,279 |