Bangladeshi vs Immigrants from Kuwait Wage/Income Gap
COMPARE
Bangladeshi
Immigrants from Kuwait
Wage/Income Gap
Wage/Income Gap Comparison
Bangladeshis
Immigrants from Kuwait
22.2%
WAGE/INCOME GAP
100.0/ 100
METRIC RATING
53rd/ 347
METRIC RANK
26.6%
WAGE/INCOME GAP
12.6/ 100
METRIC RATING
209th/ 347
METRIC RANK
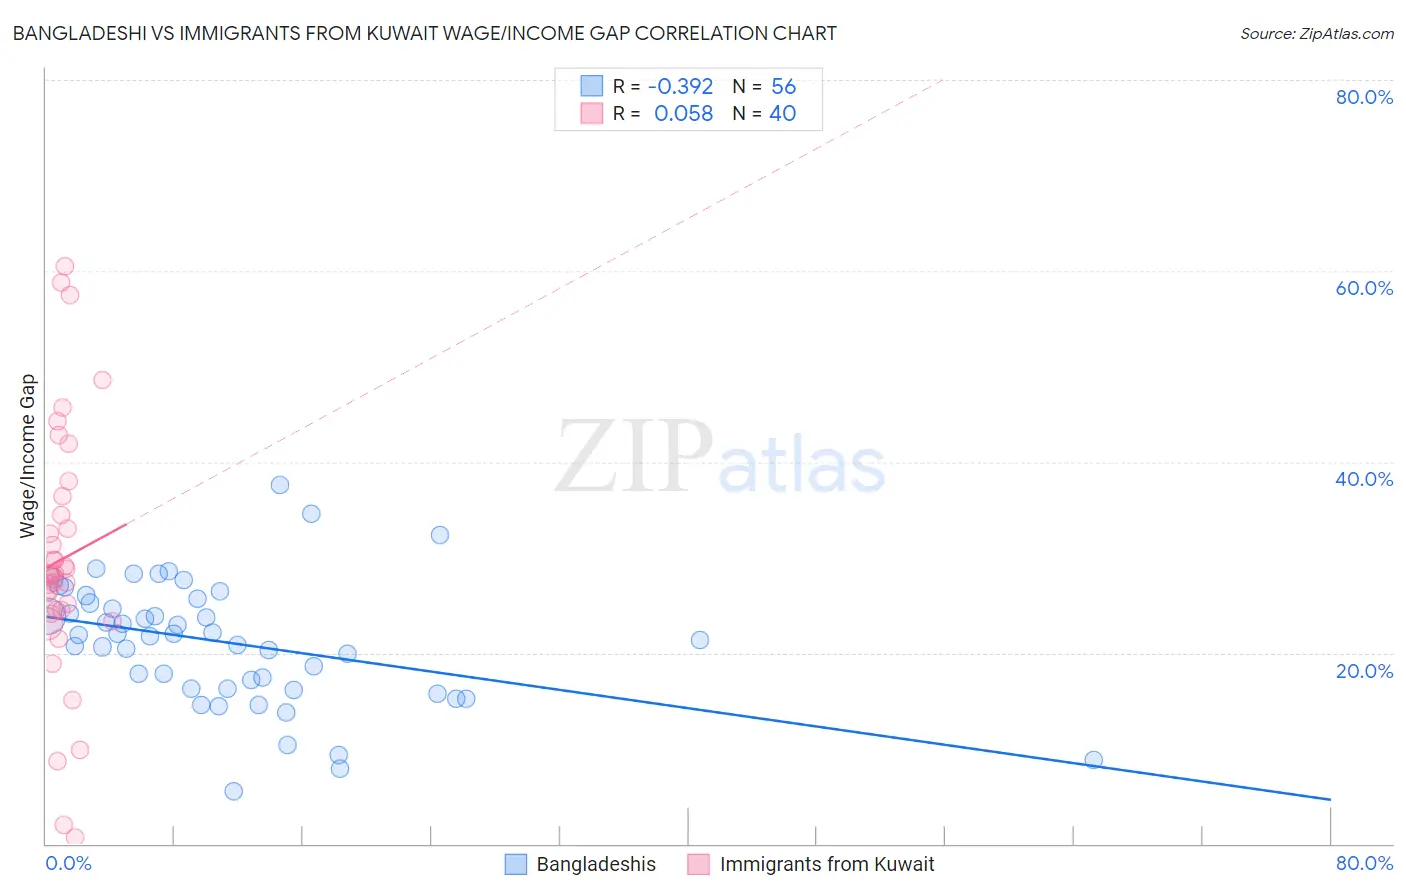
Bangladeshi vs Immigrants from Kuwait Wage/Income Gap Correlation Chart
The statistical analysis conducted on geographies consisting of 141,421,838 people shows a mild negative correlation between the proportion of Bangladeshis and wage/income gap percentage in the United States with a correlation coefficient (R) of -0.392 and weighted average of 22.2%. Similarly, the statistical analysis conducted on geographies consisting of 136,915,503 people shows a slight positive correlation between the proportion of Immigrants from Kuwait and wage/income gap percentage in the United States with a correlation coefficient (R) of 0.058 and weighted average of 26.6%, a difference of 19.9%.
Wage/Income Gap Correlation Summary
| Measurement | Bangladeshi | Immigrants from Kuwait |
| Minimum | 5.5% | 0.69% |
| Maximum | 37.6% | 60.5% |
| Range | 32.1% | 59.8% |
| Mean | 21.1% | 29.8% |
| Median | 21.8% | 28.2% |
| Interquartile 25% (IQ1) | 16.2% | 24.3% |
| Interquartile 75% (IQ3) | 25.4% | 35.4% |
| Interquartile Range (IQR) | 9.2% | 11.1% |
| Standard Deviation (Sample) | 6.5% | 13.4% |
| Standard Deviation (Population) | 6.5% | 13.2% |
Similar Demographics by Wage/Income Gap
Demographics Similar to Bangladeshis by Wage/Income Gap
In terms of wage/income gap, the demographic groups most similar to Bangladeshis are Immigrants from Cameroon (22.2%, a difference of 0.010%), Tohono O'odham (22.1%, a difference of 0.10%), Nepalese (22.2%, a difference of 0.23%), Immigrants from Western Africa (22.0%, a difference of 0.53%), and Immigrants from Zaire (22.3%, a difference of 0.63%).
| Demographics | Rating | Rank | Wage/Income Gap |
| Immigrants | Ethiopia | 100.0 /100 | #46 | Exceptional 21.6% |
| Immigrants | Congo | 100.0 /100 | #47 | Exceptional 21.7% |
| Blacks/African Americans | 100.0 /100 | #48 | Exceptional 21.7% |
| Ethiopians | 100.0 /100 | #49 | Exceptional 21.8% |
| Immigrants | Western Africa | 100.0 /100 | #50 | Exceptional 22.0% |
| Tohono O'odham | 100.0 /100 | #51 | Exceptional 22.1% |
| Immigrants | Cameroon | 100.0 /100 | #52 | Exceptional 22.2% |
| Bangladeshis | 100.0 /100 | #53 | Exceptional 22.2% |
| Nepalese | 100.0 /100 | #54 | Exceptional 22.2% |
| Immigrants | Zaire | 100.0 /100 | #55 | Exceptional 22.3% |
| Immigrants | Ghana | 100.0 /100 | #56 | Exceptional 22.3% |
| Ghanaians | 100.0 /100 | #57 | Exceptional 22.3% |
| Immigrants | Cuba | 100.0 /100 | #58 | Exceptional 22.4% |
| Navajo | 100.0 /100 | #59 | Exceptional 22.4% |
| Immigrants | Middle Africa | 100.0 /100 | #60 | Exceptional 22.4% |
Demographics Similar to Immigrants from Kuwait by Wage/Income Gap
In terms of wage/income gap, the demographic groups most similar to Immigrants from Kuwait are Egyptian (26.6%, a difference of 0.020%), Arab (26.6%, a difference of 0.040%), Mongolian (26.6%, a difference of 0.17%), Iraqi (26.6%, a difference of 0.20%), and Immigrants from Iraq (26.7%, a difference of 0.35%).
| Demographics | Rating | Rank | Wage/Income Gap |
| Laotians | 19.2 /100 | #202 | Poor 26.4% |
| Immigrants | Eastern Europe | 19.2 /100 | #203 | Poor 26.4% |
| Immigrants | Russia | 19.0 /100 | #204 | Poor 26.4% |
| Immigrants | Southern Europe | 17.3 /100 | #205 | Poor 26.4% |
| Indians (Asian) | 16.5 /100 | #206 | Poor 26.4% |
| Immigrants | Italy | 15.8 /100 | #207 | Poor 26.5% |
| Egyptians | 12.7 /100 | #208 | Poor 26.6% |
| Immigrants | Kuwait | 12.6 /100 | #209 | Poor 26.6% |
| Arabs | 12.3 /100 | #210 | Poor 26.6% |
| Mongolians | 11.4 /100 | #211 | Poor 26.6% |
| Iraqis | 11.2 /100 | #212 | Poor 26.6% |
| Immigrants | Iraq | 10.3 /100 | #213 | Poor 26.7% |
| Immigrants | China | 10.3 /100 | #214 | Poor 26.7% |
| Yugoslavians | 9.7 /100 | #215 | Tragic 26.7% |
| Immigrants | Portugal | 9.5 /100 | #216 | Tragic 26.7% |