Alaska Native vs Immigrants from Kuwait Wage/Income Gap
COMPARE
Alaska Native
Immigrants from Kuwait
Wage/Income Gap
Wage/Income Gap Comparison
Alaska Natives
Immigrants from Kuwait
24.4%
WAGE/INCOME GAP
96.0/ 100
METRIC RATING
116th/ 347
METRIC RANK
26.6%
WAGE/INCOME GAP
12.6/ 100
METRIC RATING
209th/ 347
METRIC RANK
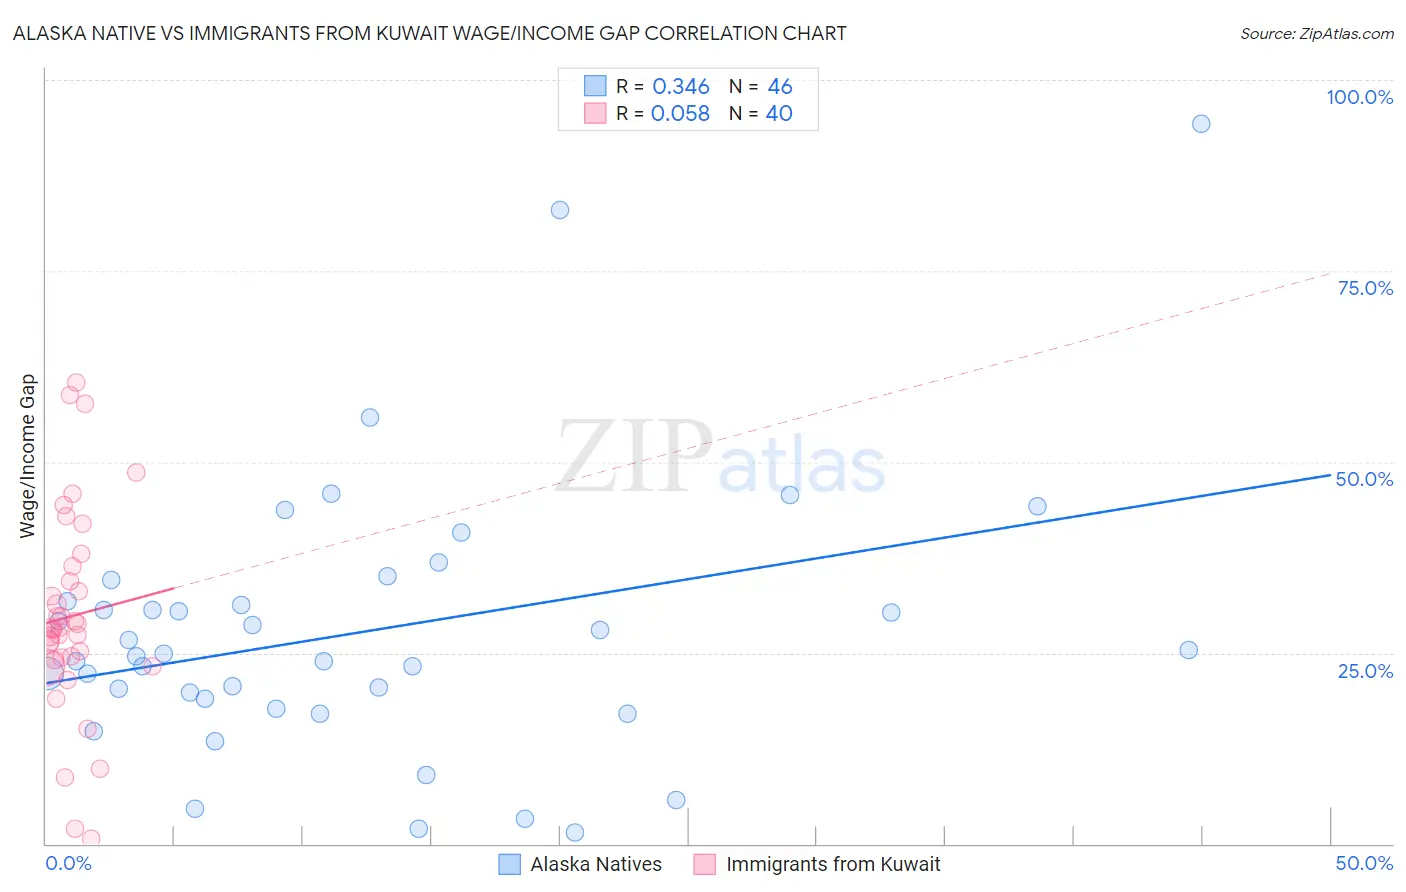
Alaska Native vs Immigrants from Kuwait Wage/Income Gap Correlation Chart
The statistical analysis conducted on geographies consisting of 76,725,822 people shows a mild positive correlation between the proportion of Alaska Natives and wage/income gap percentage in the United States with a correlation coefficient (R) of 0.346 and weighted average of 24.4%. Similarly, the statistical analysis conducted on geographies consisting of 136,915,503 people shows a slight positive correlation between the proportion of Immigrants from Kuwait and wage/income gap percentage in the United States with a correlation coefficient (R) of 0.058 and weighted average of 26.6%, a difference of 8.8%.
Wage/Income Gap Correlation Summary
| Measurement | Alaska Native | Immigrants from Kuwait |
| Minimum | 1.4% | 0.69% |
| Maximum | 94.2% | 60.5% |
| Range | 92.8% | 59.8% |
| Mean | 27.7% | 29.8% |
| Median | 24.7% | 28.2% |
| Interquartile 25% (IQ1) | 18.9% | 24.3% |
| Interquartile 75% (IQ3) | 31.7% | 35.4% |
| Interquartile Range (IQR) | 12.8% | 11.1% |
| Standard Deviation (Sample) | 17.8% | 13.4% |
| Standard Deviation (Population) | 17.6% | 13.2% |
Similar Demographics by Wage/Income Gap
Demographics Similar to Alaska Natives by Wage/Income Gap
In terms of wage/income gap, the demographic groups most similar to Alaska Natives are Immigrants from Afghanistan (24.4%, a difference of 0.060%), Immigrants from Micronesia (24.4%, a difference of 0.090%), Kenyan (24.5%, a difference of 0.11%), Immigrants from Kenya (24.4%, a difference of 0.17%), and Cree (24.5%, a difference of 0.19%).
| Demographics | Rating | Rank | Wage/Income Gap |
| Ugandans | 98.3 /100 | #109 | Exceptional 24.1% |
| Immigrants | Morocco | 98.1 /100 | #110 | Exceptional 24.1% |
| Soviet Union | 97.6 /100 | #111 | Exceptional 24.2% |
| Immigrants | Colombia | 97.0 /100 | #112 | Exceptional 24.3% |
| Sioux | 96.9 /100 | #113 | Exceptional 24.3% |
| Panamanians | 96.5 /100 | #114 | Exceptional 24.4% |
| Immigrants | Kenya | 96.4 /100 | #115 | Exceptional 24.4% |
| Alaska Natives | 96.0 /100 | #116 | Exceptional 24.4% |
| Immigrants | Afghanistan | 95.9 /100 | #117 | Exceptional 24.4% |
| Immigrants | Micronesia | 95.8 /100 | #118 | Exceptional 24.4% |
| Kenyans | 95.8 /100 | #119 | Exceptional 24.5% |
| Cree | 95.6 /100 | #120 | Exceptional 24.5% |
| Immigrants | Thailand | 94.9 /100 | #121 | Exceptional 24.5% |
| Apache | 94.8 /100 | #122 | Exceptional 24.5% |
| Natives/Alaskans | 94.6 /100 | #123 | Exceptional 24.6% |
Demographics Similar to Immigrants from Kuwait by Wage/Income Gap
In terms of wage/income gap, the demographic groups most similar to Immigrants from Kuwait are Egyptian (26.6%, a difference of 0.020%), Arab (26.6%, a difference of 0.040%), Mongolian (26.6%, a difference of 0.17%), Iraqi (26.6%, a difference of 0.20%), and Immigrants from Iraq (26.7%, a difference of 0.35%).
| Demographics | Rating | Rank | Wage/Income Gap |
| Laotians | 19.2 /100 | #202 | Poor 26.4% |
| Immigrants | Eastern Europe | 19.2 /100 | #203 | Poor 26.4% |
| Immigrants | Russia | 19.0 /100 | #204 | Poor 26.4% |
| Immigrants | Southern Europe | 17.3 /100 | #205 | Poor 26.4% |
| Indians (Asian) | 16.5 /100 | #206 | Poor 26.4% |
| Immigrants | Italy | 15.8 /100 | #207 | Poor 26.5% |
| Egyptians | 12.7 /100 | #208 | Poor 26.6% |
| Immigrants | Kuwait | 12.6 /100 | #209 | Poor 26.6% |
| Arabs | 12.3 /100 | #210 | Poor 26.6% |
| Mongolians | 11.4 /100 | #211 | Poor 26.6% |
| Iraqis | 11.2 /100 | #212 | Poor 26.6% |
| Immigrants | Iraq | 10.3 /100 | #213 | Poor 26.7% |
| Immigrants | China | 10.3 /100 | #214 | Poor 26.7% |
| Yugoslavians | 9.7 /100 | #215 | Tragic 26.7% |
| Immigrants | Portugal | 9.5 /100 | #216 | Tragic 26.7% |