Immigrants from Iran vs Immigrants from Kuwait Wage/Income Gap

COMPARE

Immigrants from Iran
Race
Ancestry
AfghanAfricanAlaska NativeAlaskan AthabascanAlbanianAleutAlsatianAmericanApacheArabArapahoArgentineanArmenianAssyrian/Chaldean/SyriacAustralianAustrianBahamianBangladeshiBarbadianBasqueBelgianBelizeanBermudanBhutaneseBlackfeetBolivianBrazilianBritishBritish West IndianBulgarianBurmeseCajunCambodianCanadianCape VerdeanCarpatho RusynCelticCentral AmericanCentral American IndianCherokeeCheyenneChickasawChileanChineseChippewaChoctawColombianColvilleComancheCosta RicanCreeCreekCroatianCrowCubanCypriotCzechCzechoslovakianDanishDelawareDominicanDutchDutch West IndianEastern EuropeanEcuadorianEgyptianEnglishEstonianEthiopianEuropeanFijianFilipinoFinnishFrenchFrench American IndianFrench CanadianGermanGerman RussianGhanaianGreekGuamanian/ChamorroGuatemalanGuyaneseHaitianHmongHonduranHopiHoumaHungarianIcelanderIndian (Asian)IndonesianInupiatIranianIraqiIrishIroquoisIsraeliItalianJamaicanJapaneseJordanianKenyanKiowaKoreanLaotianLatvianLebaneseLiberianLithuanianLumbeeLuxembourgerMacedonianMalaysianMalteseMarshalleseMenomineeMexicanMexican American IndianMongolianMoroccanNative HawaiianNavajoNepaleseNew ZealanderNicaraguanNigerianNorthern EuropeanNorwegianOkinawanOsageOttawaPaiutePakistaniPalestinianPanamanianParaguayanPennsylvania GermanPeruvianPimaPolishPortuguesePotawatomiPuebloPuerto RicanPuget Sound SalishRomanianRussianSalvadoranSamoanScandinavianScotch-IrishScottishSeminoleSenegaleseSerbianShoshoneSierra LeoneanSiouxSlavicSlovakSloveneSomaliSouth AfricanSouth AmericanSouth American IndianSoviet UnionSpaniardSpanishSpanish AmericanSpanish American IndianSri LankanSubsaharan AfricanSudaneseSwedishSwissSyrianTaiwaneseThaiTlingit-HaidaTohono O'OdhamTonganTrinidadian and TobagonianTsimshianTurkishU.S. Virgin IslanderUgandanUkrainianUruguayanUteVenezuelanVietnameseWelshWest IndianYakamaYaquiYugoslavianYumanYup'ikZimbabwean
Immigration
NonimmigrantsImmigrantsAfghanistanAfricaAlbaniaArgentinaArmeniaAsiaAustraliaAustriaBahamasBangladeshBarbadosBelarusBelgiumBelizeBoliviaBosnia and HerzegovinaBrazilBulgariaBurma/MyanmarCabo VerdeCambodiaCameroonCanadaCaribbeanCentral AmericaChileChinaColombiaCongoCosta RicaCroatiaCubaCzechoslovakiaDenmarkDominicaDominican RepublicEastern AfricaEastern AsiaEastern EuropeEcuadorEgyptEl SalvadorEnglandEritreaEthiopiaEuropeFijiFranceGermanyGhanaGreeceGrenadaGuatemalaGuyanaHaitiHondurasHong KongHungaryIndiaIndonesiaIranIraqIrelandIsraelItalyJamaicaJapanJordanKazakhstanKenyaKoreaLaosLatin AmericaLatviaLebanonLiberiaLithuaniaMalaysiaMexicoMicronesiaMiddle AfricaMoldovaMoroccoNepalNetherlandsNicaraguaNigeriaNorth AmericaNorth MacedoniaNorthern AfricaNorthern EuropeNorwayOceaniaPakistanPanamaPeruPhilippinesPolandPortugalRomaniaRussiaSaudi ArabiaScotlandSenegalSerbiaSierra LeoneSingaporeSomaliaSouth AfricaSouth AmericaSouth Central AsiaSouth Eastern AsiaSouthern EuropeSpainSri LankaSt. Vincent and the GrenadinesSudanSwedenSwitzerlandSyriaTaiwanThailandTrinidad and TobagoTurkeyUgandaUkraineUruguayUzbekistanVenezuelaVietnamWest IndiesWestern AfricaWestern AsiaWestern EuropeYemenZaireZimbabweAzores
Immigrants from Kuwait
Race
Ancestry
AfghanAfricanAlaska NativeAlaskan AthabascanAlbanianAleutAlsatianAmericanApacheArabArapahoArgentineanArmenianAssyrian/Chaldean/SyriacAustralianAustrianBahamianBangladeshiBarbadianBasqueBelgianBelizeanBermudanBhutaneseBlackfeetBolivianBrazilianBritishBritish West IndianBulgarianBurmeseCajunCambodianCanadianCape VerdeanCarpatho RusynCelticCentral AmericanCentral American IndianCherokeeCheyenneChickasawChileanChineseChippewaChoctawColombianColvilleComancheCosta RicanCreeCreekCroatianCrowCubanCypriotCzechCzechoslovakianDanishDelawareDominicanDutchDutch West IndianEastern EuropeanEcuadorianEgyptianEnglishEstonianEthiopianEuropeanFijianFilipinoFinnishFrenchFrench American IndianFrench CanadianGermanGerman RussianGhanaianGreekGuamanian/ChamorroGuatemalanGuyaneseHaitianHmongHonduranHopiHoumaHungarianIcelanderIndian (Asian)IndonesianInupiatIranianIraqiIrishIroquoisIsraeliItalianJamaicanJapaneseJordanianKenyanKiowaKoreanLaotianLatvianLebaneseLiberianLithuanianLumbeeLuxembourgerMacedonianMalaysianMalteseMarshalleseMenomineeMexicanMexican American IndianMongolianMoroccanNative HawaiianNavajoNepaleseNew ZealanderNicaraguanNigerianNorthern EuropeanNorwegianOkinawanOsageOttawaPaiutePakistaniPalestinianPanamanianParaguayanPennsylvania GermanPeruvianPimaPolishPortuguesePotawatomiPuebloPuerto RicanPuget Sound SalishRomanianRussianSalvadoranSamoanScandinavianScotch-IrishScottishSeminoleSenegaleseSerbianShoshoneSierra LeoneanSiouxSlavicSlovakSloveneSomaliSouth AfricanSouth AmericanSouth American IndianSoviet UnionSpaniardSpanishSpanish AmericanSpanish American IndianSri LankanSubsaharan AfricanSudaneseSwedishSwissSyrianTaiwaneseThaiTlingit-HaidaTohono O'OdhamTonganTrinidadian and TobagonianTsimshianTurkishU.S. Virgin IslanderUgandanUkrainianUruguayanUteVenezuelanVietnameseWelshWest IndianYakamaYaquiYugoslavianYumanYup'ikZimbabwean
Immigration
NonimmigrantsImmigrantsAfghanistanAfricaAlbaniaArgentinaArmeniaAsiaAustraliaAustriaBahamasBangladeshBarbadosBelarusBelgiumBelizeBoliviaBosnia and HerzegovinaBrazilBulgariaBurma/MyanmarCabo VerdeCambodiaCameroonCanadaCaribbeanCentral AmericaChileChinaColombiaCongoCosta RicaCroatiaCubaCzechoslovakiaDenmarkDominicaDominican RepublicEastern AfricaEastern AsiaEastern EuropeEcuadorEgyptEl SalvadorEnglandEritreaEthiopiaEuropeFijiFranceGermanyGhanaGreeceGrenadaGuatemalaGuyanaHaitiHondurasHong KongHungaryIndiaIndonesiaIraqIrelandIsraelItalyJamaicaJapanJordanKazakhstanKenyaKoreaKuwaitLaosLatin AmericaLatviaLebanonLiberiaLithuaniaMalaysiaMexicoMicronesiaMiddle AfricaMoldovaMoroccoNepalNetherlandsNicaraguaNigeriaNorth AmericaNorth MacedoniaNorthern AfricaNorthern EuropeNorwayOceaniaPakistanPanamaPeruPhilippinesPolandPortugalRomaniaRussiaSaudi ArabiaScotlandSenegalSerbiaSierra LeoneSingaporeSomaliaSouth AfricaSouth AmericaSouth Central AsiaSouth Eastern AsiaSouthern EuropeSpainSri LankaSt. Vincent and the GrenadinesSudanSwedenSwitzerlandSyriaTaiwanThailandTrinidad and TobagoTurkeyUgandaUkraineUruguayUzbekistanVenezuelaVietnamWest IndiesWestern AfricaWestern AsiaWestern EuropeYemenZaireZimbabweAzores
Wage/Income Gap
Income
Poverty
Unemployment
Labor Participation
Family Structure
Vehicle Availability
Education Level
Disability

Wage/Income Gap Comparison

Immigrants from Iran

Immigrants from Kuwait

Tragic
Poor
29.1%
WAGE/INCOME GAP
0.0/ 100
METRIC RATING
327th/ 347
METRIC RANK
26.6%
WAGE/INCOME GAP
12.6/ 100
METRIC RATING
209th/ 347
METRIC RANK

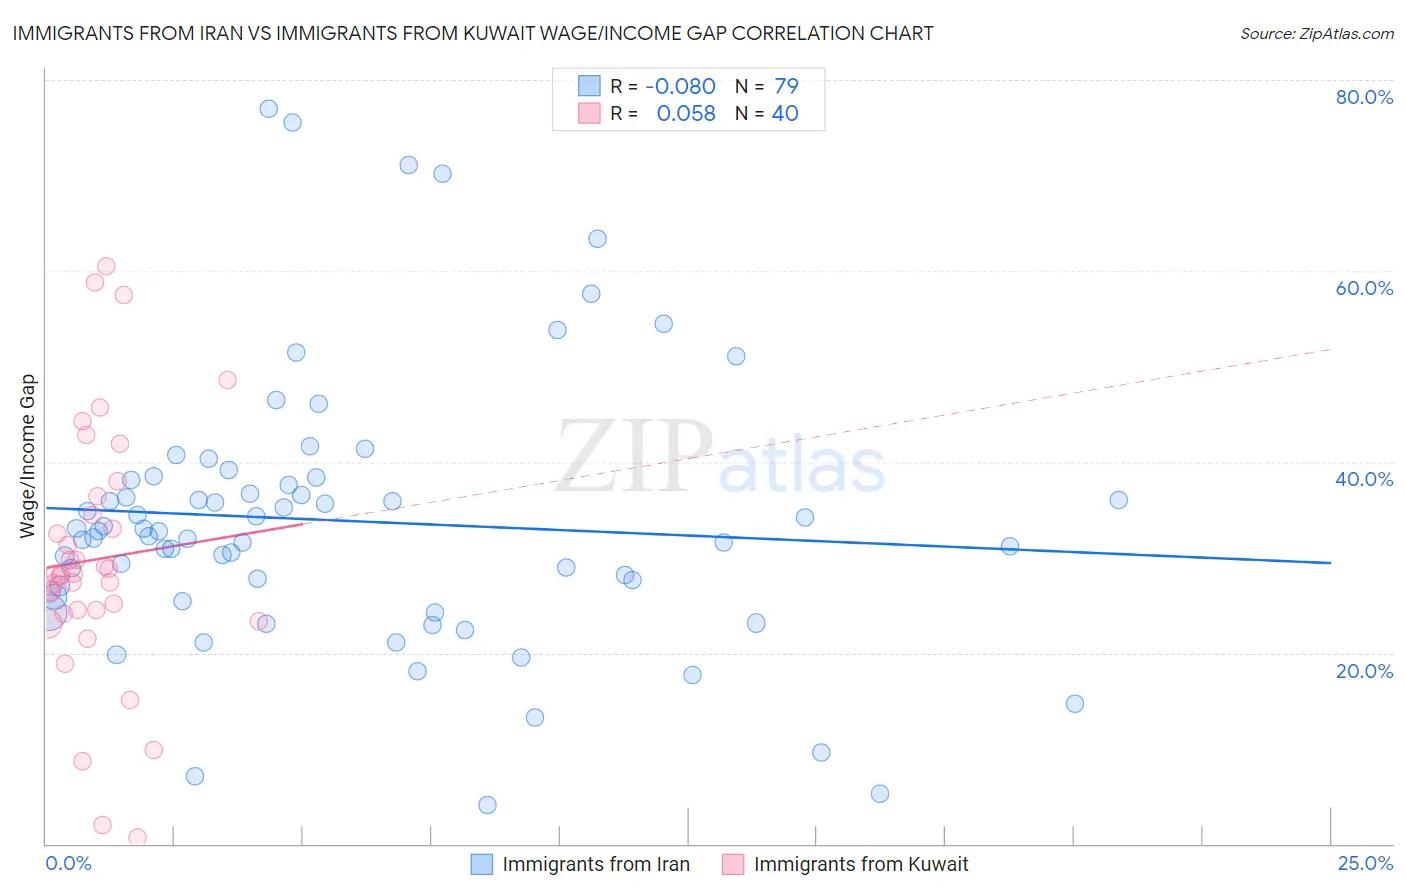
Immigrants from Iran vs Immigrants from Kuwait Wage/Income Gap Correlation Chart

The statistical analysis conducted on geographies consisting of 279,798,376 people shows a slight negative correlation between the proportion of Immigrants from Iran and wage/income gap percentage in the United States with a correlation coefficient (R) of -0.080 and weighted average of 29.1%. Similarly, the statistical analysis conducted on geographies consisting of 136,915,503 people shows a slight positive correlation between the proportion of Immigrants from Kuwait and wage/income gap percentage in the United States with a correlation coefficient (R) of 0.058 and weighted average of 26.6%, a difference of 9.4%.
Immigrants from Iran vs Immigrants from Kuwait Wage/Income Gap

Wage/Income Gap Correlation Summary

MeasurementImmigrants from IranImmigrants from Kuwait
Minimum4.0%0.69%
Maximum77.0%60.5%
Range73.0%59.8%
Mean33.8%29.8%
Median32.7%28.2%
Interquartile 25% (IQ1)25.9%24.3%
Interquartile 75% (IQ3)38.2%35.4%
Interquartile Range (IQR)12.3%11.1%
Standard Deviation (Sample)14.3%13.4%
Standard Deviation (Population)14.2%13.2%

Similar Demographics by Wage/Income Gap

Demographics Similar to Immigrants from Iran by Wage/Income Gap

In terms of wage/income gap, the demographic groups most similar to Immigrants from Iran are Scandinavian (29.1%, a difference of 0.060%), Immigrants from Belgium (29.0%, a difference of 0.11%), Hungarian (29.0%, a difference of 0.18%), Scottish (29.1%, a difference of 0.20%), and German (29.2%, a difference of 0.30%).
DemographicsRating | RankWage/Income Gap
British
0.1
/100
|
#320
Tragic
28.9%
Welsh
0.1
/100
|
#321
Tragic
28.9%
Immigrants | Singapore
0.1
/100
|
#322
Tragic
28.9%
Norwegians
0.1
/100
|
#323
Tragic
29.0%
Croatians
0.0
/100
|
#324
Tragic
29.0%
Hungarians
0.0
/100
|
#325
Tragic
29.0%
Immigrants | Belgium
0.0
/100
|
#326
Tragic
29.0%
Immigrants | Iran
0.0
/100
|
#327
Tragic
29.1%
Scandinavians
0.0
/100
|
#328
Tragic
29.1%
Scottish
0.0
/100
|
#329
Tragic
29.1%
Germans
0.0
/100
|
#330
Tragic
29.2%
Czechs
0.0
/100
|
#331
Tragic
29.2%
Immigrants | South Central Asia
0.0
/100
|
#332
Tragic
29.3%
Europeans
0.0
/100
|
#333
Tragic
29.4%
Swedes
0.0
/100
|
#334
Tragic
29.4%

Demographics Similar to Immigrants from Kuwait by Wage/Income Gap

In terms of wage/income gap, the demographic groups most similar to Immigrants from Kuwait are Egyptian (26.6%, a difference of 0.020%), Arab (26.6%, a difference of 0.040%), Mongolian (26.6%, a difference of 0.17%), Iraqi (26.6%, a difference of 0.20%), and Immigrants from Iraq (26.7%, a difference of 0.35%).
DemographicsRating | RankWage/Income Gap
Laotians
19.2
/100
|
#202
Poor
26.4%
Immigrants | Eastern Europe
19.2
/100
|
#203
Poor
26.4%
Immigrants | Russia
19.0
/100
|
#204
Poor
26.4%
Immigrants | Southern Europe
17.3
/100
|
#205
Poor
26.4%
Indians (Asian)
16.5
/100
|
#206
Poor
26.4%
Immigrants | Italy
15.8
/100
|
#207
Poor
26.5%
Egyptians
12.7
/100
|
#208
Poor
26.6%
Immigrants | Kuwait
12.6
/100
|
#209
Poor
26.6%
Arabs
12.3
/100
|
#210
Poor
26.6%
Mongolians
11.4
/100
|
#211
Poor
26.6%
Iraqis
11.2
/100
|
#212
Poor
26.6%
Immigrants | Iraq
10.3
/100
|
#213
Poor
26.7%
Immigrants | China
10.3
/100
|
#214
Poor
26.7%
Yugoslavians
9.7
/100
|
#215
Tragic
26.7%
Immigrants | Portugal
9.5
/100
|
#216
Tragic
26.7%