Osage vs Immigrants from Kuwait Wage/Income Gap
COMPARE
Osage
Immigrants from Kuwait
Wage/Income Gap
Wage/Income Gap Comparison
Osage
Immigrants from Kuwait
27.1%
WAGE/INCOME GAP
4.4/ 100
METRIC RATING
238th/ 347
METRIC RANK
26.6%
WAGE/INCOME GAP
12.6/ 100
METRIC RATING
209th/ 347
METRIC RANK
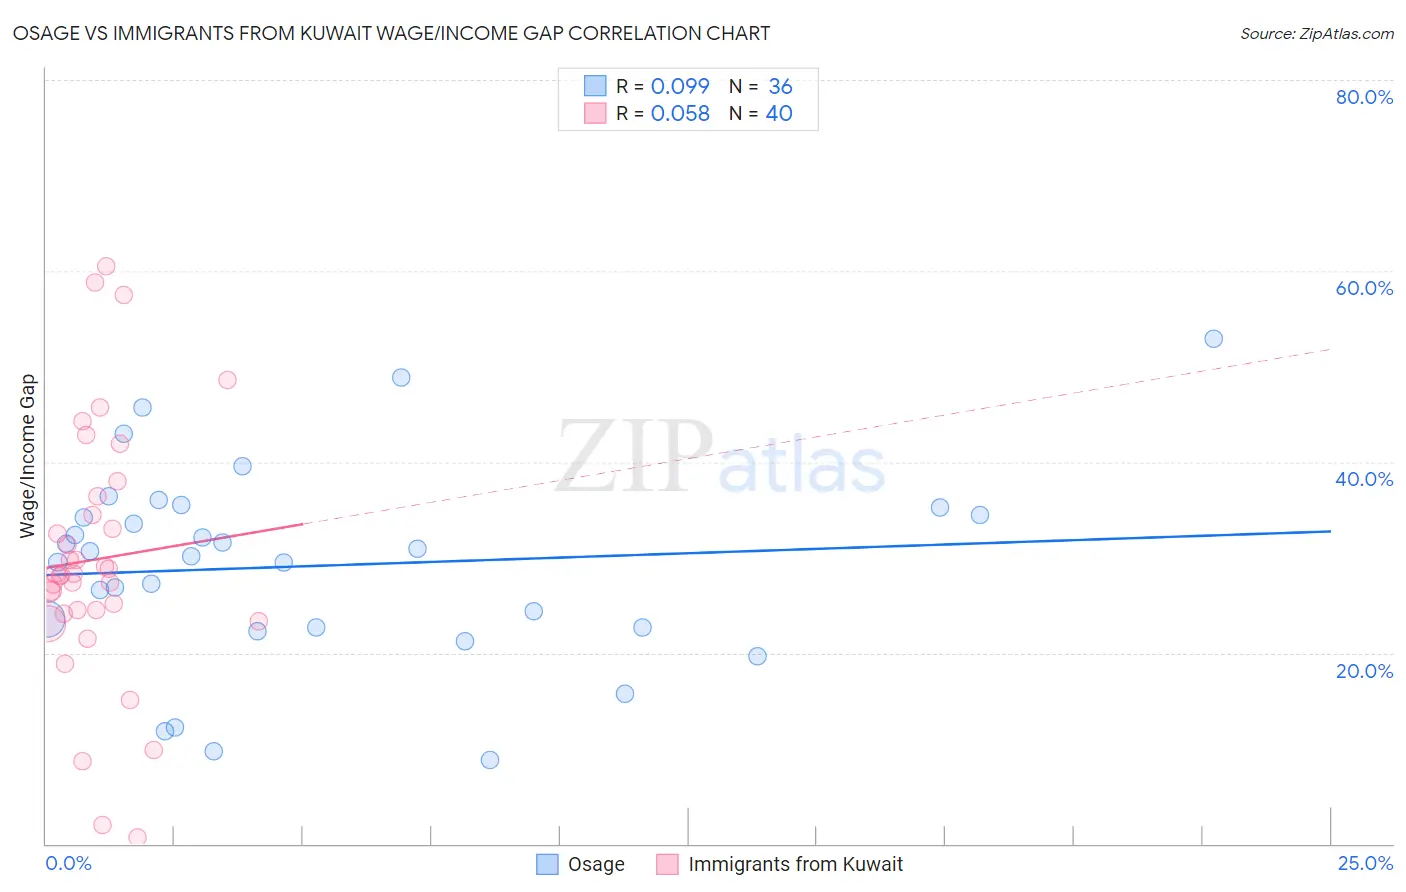
Osage vs Immigrants from Kuwait Wage/Income Gap Correlation Chart
The statistical analysis conducted on geographies consisting of 91,772,804 people shows a slight positive correlation between the proportion of Osage and wage/income gap percentage in the United States with a correlation coefficient (R) of 0.099 and weighted average of 27.1%. Similarly, the statistical analysis conducted on geographies consisting of 136,915,503 people shows a slight positive correlation between the proportion of Immigrants from Kuwait and wage/income gap percentage in the United States with a correlation coefficient (R) of 0.058 and weighted average of 26.6%, a difference of 1.8%.
Wage/Income Gap Correlation Summary
| Measurement | Osage | Immigrants from Kuwait |
| Minimum | 8.8% | 0.69% |
| Maximum | 52.9% | 60.5% |
| Range | 44.1% | 59.8% |
| Mean | 29.1% | 29.8% |
| Median | 30.4% | 28.2% |
| Interquartile 25% (IQ1) | 22.6% | 24.3% |
| Interquartile 75% (IQ3) | 34.9% | 35.4% |
| Interquartile Range (IQR) | 12.2% | 11.1% |
| Standard Deviation (Sample) | 10.3% | 13.4% |
| Standard Deviation (Population) | 10.2% | 13.2% |
Similar Demographics by Wage/Income Gap
Demographics Similar to Osage by Wage/Income Gap
In terms of wage/income gap, the demographic groups most similar to Osage are Immigrants from Eastern Asia (27.1%, a difference of 0.0%), Estonian (27.1%, a difference of 0.020%), Immigrants from Romania (27.0%, a difference of 0.15%), Immigrants from Hungary (27.0%, a difference of 0.16%), and Immigrants from Pakistan (27.0%, a difference of 0.18%).
| Demographics | Rating | Rank | Wage/Income Gap |
| Bhutanese | 5.3 /100 | #231 | Tragic 27.0% |
| Argentineans | 5.2 /100 | #232 | Tragic 27.0% |
| Immigrants | Brazil | 5.0 /100 | #233 | Tragic 27.0% |
| Immigrants | Pakistan | 4.9 /100 | #234 | Tragic 27.0% |
| Immigrants | Hungary | 4.8 /100 | #235 | Tragic 27.0% |
| Immigrants | Romania | 4.8 /100 | #236 | Tragic 27.0% |
| Immigrants | Eastern Asia | 4.4 /100 | #237 | Tragic 27.1% |
| Osage | 4.4 /100 | #238 | Tragic 27.1% |
| Estonians | 4.3 /100 | #239 | Tragic 27.1% |
| Immigrants | Europe | 3.8 /100 | #240 | Tragic 27.1% |
| Creek | 3.8 /100 | #241 | Tragic 27.1% |
| Immigrants | Sri Lanka | 3.7 /100 | #242 | Tragic 27.1% |
| Spanish | 3.6 /100 | #243 | Tragic 27.1% |
| Chickasaw | 3.5 /100 | #244 | Tragic 27.2% |
| Immigrants | Azores | 3.5 /100 | #245 | Tragic 27.2% |
Demographics Similar to Immigrants from Kuwait by Wage/Income Gap
In terms of wage/income gap, the demographic groups most similar to Immigrants from Kuwait are Egyptian (26.6%, a difference of 0.020%), Arab (26.6%, a difference of 0.040%), Mongolian (26.6%, a difference of 0.17%), Iraqi (26.6%, a difference of 0.20%), and Immigrants from Iraq (26.7%, a difference of 0.35%).
| Demographics | Rating | Rank | Wage/Income Gap |
| Laotians | 19.2 /100 | #202 | Poor 26.4% |
| Immigrants | Eastern Europe | 19.2 /100 | #203 | Poor 26.4% |
| Immigrants | Russia | 19.0 /100 | #204 | Poor 26.4% |
| Immigrants | Southern Europe | 17.3 /100 | #205 | Poor 26.4% |
| Indians (Asian) | 16.5 /100 | #206 | Poor 26.4% |
| Immigrants | Italy | 15.8 /100 | #207 | Poor 26.5% |
| Egyptians | 12.7 /100 | #208 | Poor 26.6% |
| Immigrants | Kuwait | 12.6 /100 | #209 | Poor 26.6% |
| Arabs | 12.3 /100 | #210 | Poor 26.6% |
| Mongolians | 11.4 /100 | #211 | Poor 26.6% |
| Iraqis | 11.2 /100 | #212 | Poor 26.6% |
| Immigrants | Iraq | 10.3 /100 | #213 | Poor 26.7% |
| Immigrants | China | 10.3 /100 | #214 | Poor 26.7% |
| Yugoslavians | 9.7 /100 | #215 | Tragic 26.7% |
| Immigrants | Portugal | 9.5 /100 | #216 | Tragic 26.7% |