Wabasso, FL Map & Demographics
Wabasso Map
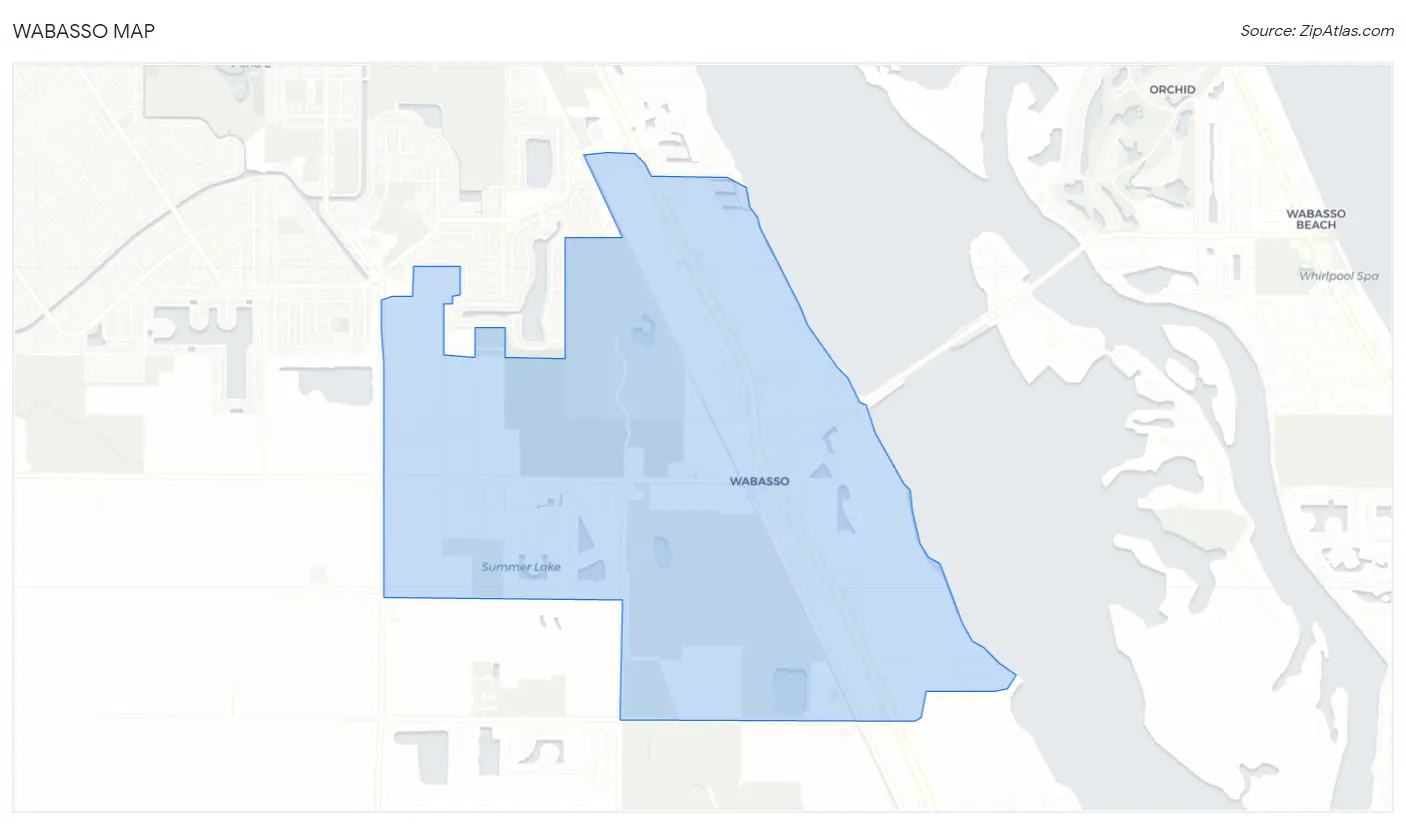
Wabasso Overview
$35,544
PER CAPITA INCOME
$53,011
AVG HOUSEHOLD INCOME
14.5%
WAGE / INCOME GAP [ % ]
85.5¢/ $1
WAGE / INCOME GAP [ $ ]
0.41
INEQUALITY / GINI INDEX
1,179
TOTAL POPULATION
504
MALE POPULATION
675
FEMALE POPULATION
74.67
MALES / 100 FEMALES
133.93
FEMALES / 100 MALES
56.8
MEDIAN AGE
3.6
AVG FAMILY SIZE
2.8
AVG HOUSEHOLD SIZE
591
LABOR FORCE [ PEOPLE ]
56.4%
PERCENT IN LABOR FORCE
1.9%
UNEMPLOYMENT RATE
Wabasso Zip Codes
Wabasso Area Codes
Income in Wabasso
Income Overview in Wabasso
| Characteristic | Number | Measure |
| Per Capita Income | 1,179 | $35,544 |
| Median Family Income | 288 | $0 |
| Mean Family Income | 288 | $109,708 |
| Median Household Income | 418 | $53,011 |
| Mean Household Income | 418 | $85,598 |
| Income Deficit | 288 | $0 |
| Wage / Income Gap (%) | 1,179 | 14.45% |
| Wage / Income Gap ($) | 1,179 | 85.55¢ per $1 |
| Gini / Inequality Index | 1,179 | 0.41 |
Earnings by Sex in Wabasso
Average Earnings in Wabasso are $26,985, $30,598 for men and $26,176 for women, a difference of 14.4%.
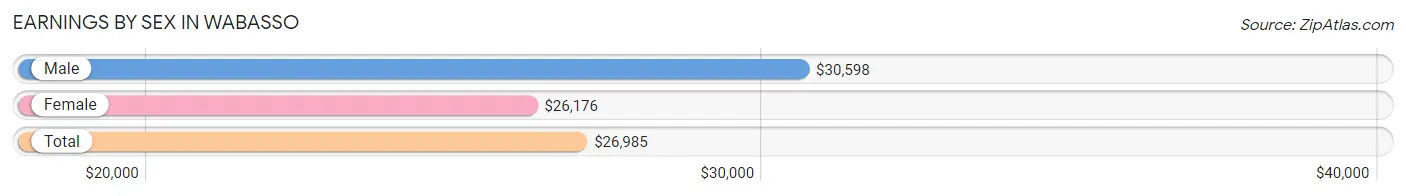
| Sex | Number | Average Earnings |
| Male | 302 (52.1%) | $30,598 |
| Female | 278 (47.9%) | $26,176 |
| Total | 580 (100.0%) | $26,985 |
Earnings by Sex by Income Bracket in Wabasso
The most common earnings brackets in Wabasso are $22,500 to $24,999 for men (91 | 30.1%) and $20,000 to $22,499 for women (67 | 24.1%).
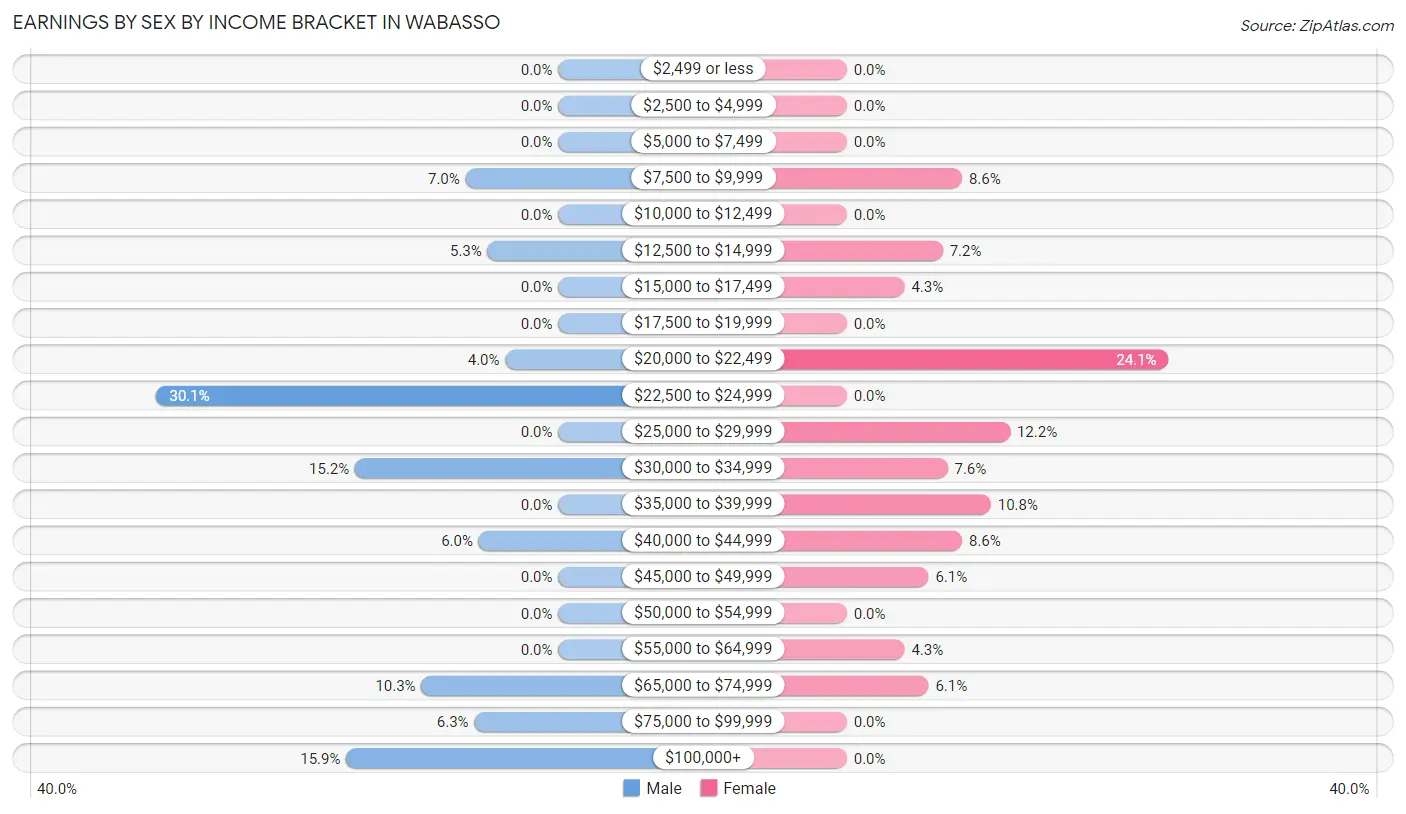
| Income | Male | Female |
| $2,499 or less | 0 (0.0%) | 0 (0.0%) |
| $2,500 to $4,999 | 0 (0.0%) | 0 (0.0%) |
| $5,000 to $7,499 | 0 (0.0%) | 0 (0.0%) |
| $7,500 to $9,999 | 21 (7.0%) | 24 (8.6%) |
| $10,000 to $12,499 | 0 (0.0%) | 0 (0.0%) |
| $12,500 to $14,999 | 16 (5.3%) | 20 (7.2%) |
| $15,000 to $17,499 | 0 (0.0%) | 12 (4.3%) |
| $17,500 to $19,999 | 0 (0.0%) | 0 (0.0%) |
| $20,000 to $22,499 | 12 (4.0%) | 67 (24.1%) |
| $22,500 to $24,999 | 91 (30.1%) | 0 (0.0%) |
| $25,000 to $29,999 | 0 (0.0%) | 34 (12.2%) |
| $30,000 to $34,999 | 46 (15.2%) | 21 (7.5%) |
| $35,000 to $39,999 | 0 (0.0%) | 30 (10.8%) |
| $40,000 to $44,999 | 18 (6.0%) | 24 (8.6%) |
| $45,000 to $49,999 | 0 (0.0%) | 17 (6.1%) |
| $50,000 to $54,999 | 0 (0.0%) | 0 (0.0%) |
| $55,000 to $64,999 | 0 (0.0%) | 12 (4.3%) |
| $65,000 to $74,999 | 31 (10.3%) | 17 (6.1%) |
| $75,000 to $99,999 | 19 (6.3%) | 0 (0.0%) |
| $100,000+ | 48 (15.9%) | 0 (0.0%) |
| Total | 302 (100.0%) | 278 (100.0%) |
Earnings by Sex by Educational Attainment in Wabasso
Average earnings in Wabasso are $31,033 for men and $31,845 for women, a difference of 2.5%. Men with an educational attainment of college or associate's degree enjoy the highest average annual earnings of $72,903, while those with bachelor's degree education earn the least with $23,723. Women with an educational attainment of college or associate's degree earn the most with the average annual earnings of $35,917, while those with college or associate's degree education have the smallest earnings of $35,917.
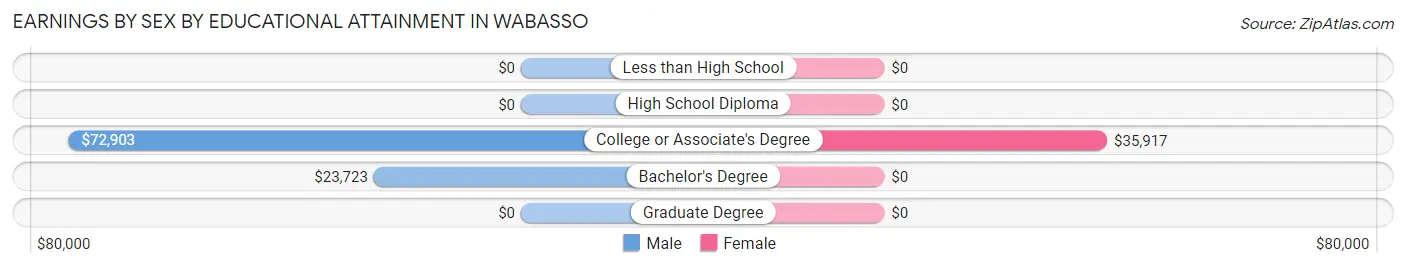
| Educational Attainment | Male Income | Female Income |
| Less than High School | - | - |
| High School Diploma | - | - |
| College or Associate's Degree | $72,903 | $35,917 |
| Bachelor's Degree | $23,723 | $0 |
| Graduate Degree | - | - |
| Total | $31,033 | $31,845 |
Family Income in Wabasso
Family Income Brackets in Wabasso
According to the Wabasso family income data, there are 75 families falling into the $50,000 to $74,999 income range, which is the most common income bracket and makes up 26.0% of all families.
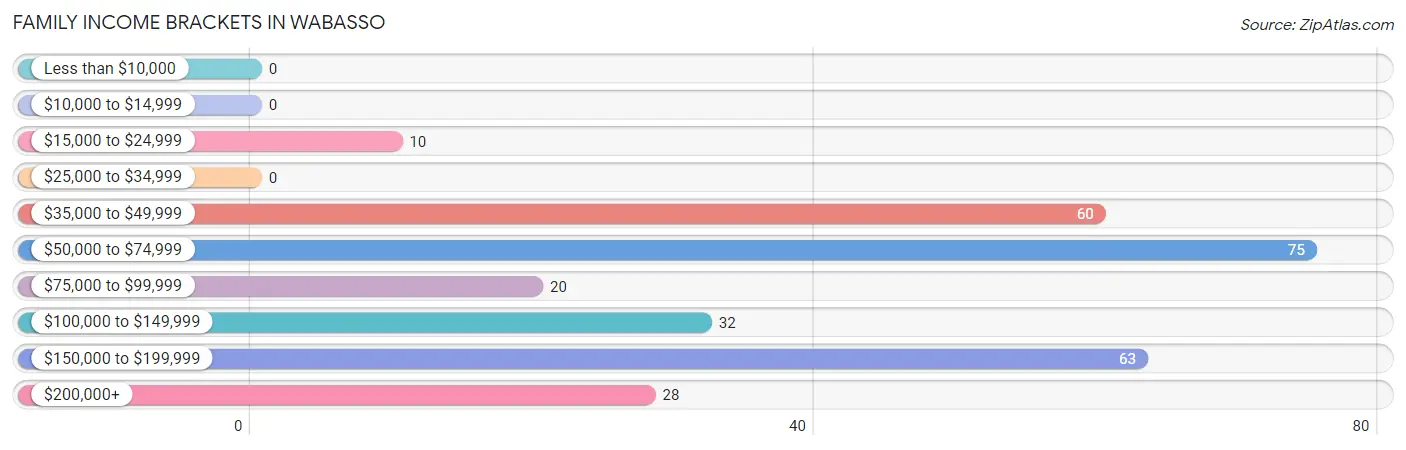
| Income Bracket | # Families | % Families |
| Less than $10,000 | 0 | 0.0% |
| $10,000 to $14,999 | 0 | 0.0% |
| $15,000 to $24,999 | 10 | 3.5% |
| $25,000 to $34,999 | 0 | 0.0% |
| $35,000 to $49,999 | 60 | 20.8% |
| $50,000 to $74,999 | 75 | 26.0% |
| $75,000 to $99,999 | 20 | 6.9% |
| $100,000 to $149,999 | 32 | 11.1% |
| $150,000 to $199,999 | 63 | 21.9% |
| $200,000+ | 28 | 9.7% |
Family Income by Famaliy Size in Wabasso
| Income Bracket | # Families | Median Income |
| 2-Person Families | 173 (60.1%) | $0 |
| 3-Person Families | 75 (26.0%) | $0 |
| 4-Person Families | 40 (13.9%) | $0 |
| 5-Person Families | 0 (0.0%) | $0 |
| 6-Person Families | 0 (0.0%) | $0 |
| 7+ Person Families | 0 (0.0%) | $0 |
| Total | 288 (100.0%) | $0 |
Family Income by Number of Earners in Wabasso
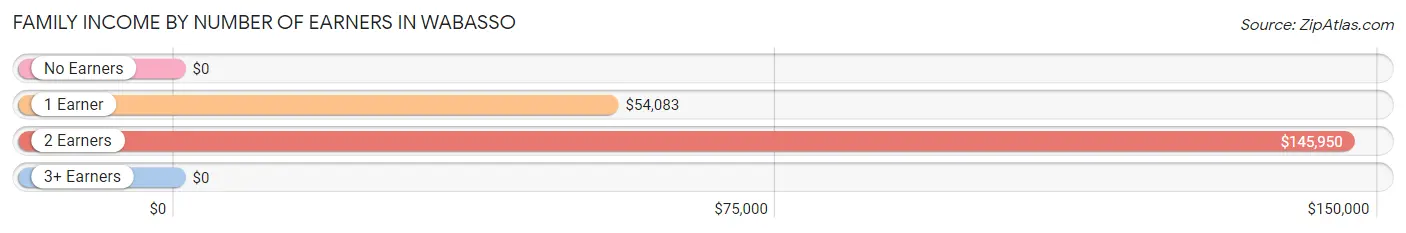
| Number of Earners | # Families | Median Income |
| No Earners | 23 (8.0%) | $0 |
| 1 Earner | 154 (53.5%) | $54,083 |
| 2 Earners | 101 (35.1%) | $145,950 |
| 3+ Earners | 10 (3.5%) | $0 |
| Total | 288 (100.0%) | $0 |
Household Income in Wabasso
Household Income Brackets in Wabasso
With 137 households falling in the category, the $35,000 to $49,999 income range is the most frequent in Wabasso, accounting for 32.8% of all households.
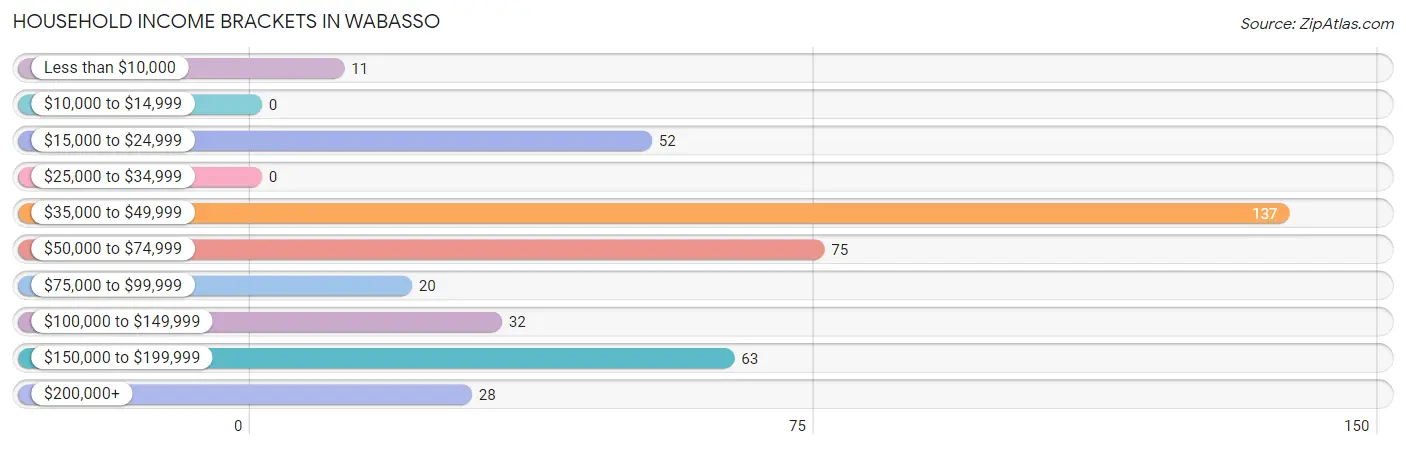
| Income Bracket | # Households | % Households |
| Less than $10,000 | 11 | 2.6% |
| $10,000 to $14,999 | 0 | 0.0% |
| $15,000 to $24,999 | 52 | 12.4% |
| $25,000 to $34,999 | 0 | 0.0% |
| $35,000 to $49,999 | 137 | 32.8% |
| $50,000 to $74,999 | 75 | 17.9% |
| $75,000 to $99,999 | 20 | 4.8% |
| $100,000 to $149,999 | 32 | 7.7% |
| $150,000 to $199,999 | 63 | 15.1% |
| $200,000+ | 28 | 6.7% |
Household Income by Householder Age in Wabasso
The median household income in Wabasso is $53,011, with the highest median household income of $50,000 found in the 45 to 64 years age bracket for the primary householder. A total of 268 households (64.1%) fall into this category.
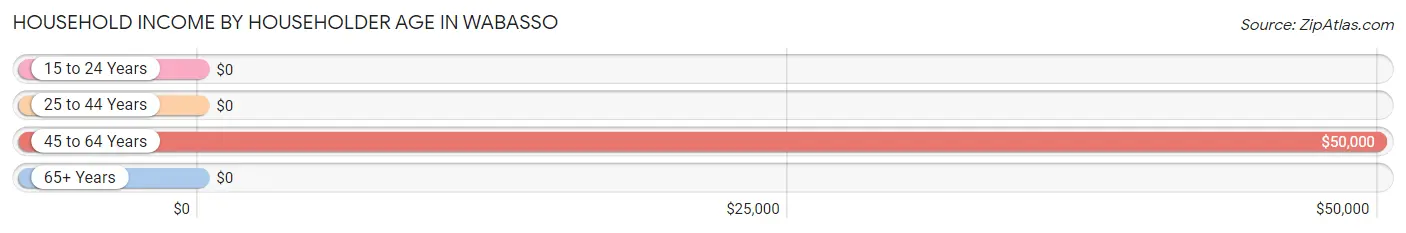
| Income Bracket | # Households | Median Income |
| 15 to 24 Years | 0 (0.0%) | $0 |
| 25 to 44 Years | 31 (7.4%) | $0 |
| 45 to 64 Years | 268 (64.1%) | $50,000 |
| 65+ Years | 119 (28.5%) | $0 |
| Total | 418 (100.0%) | $53,011 |
Poverty in Wabasso
Income Below Poverty by Sex and Age in Wabasso
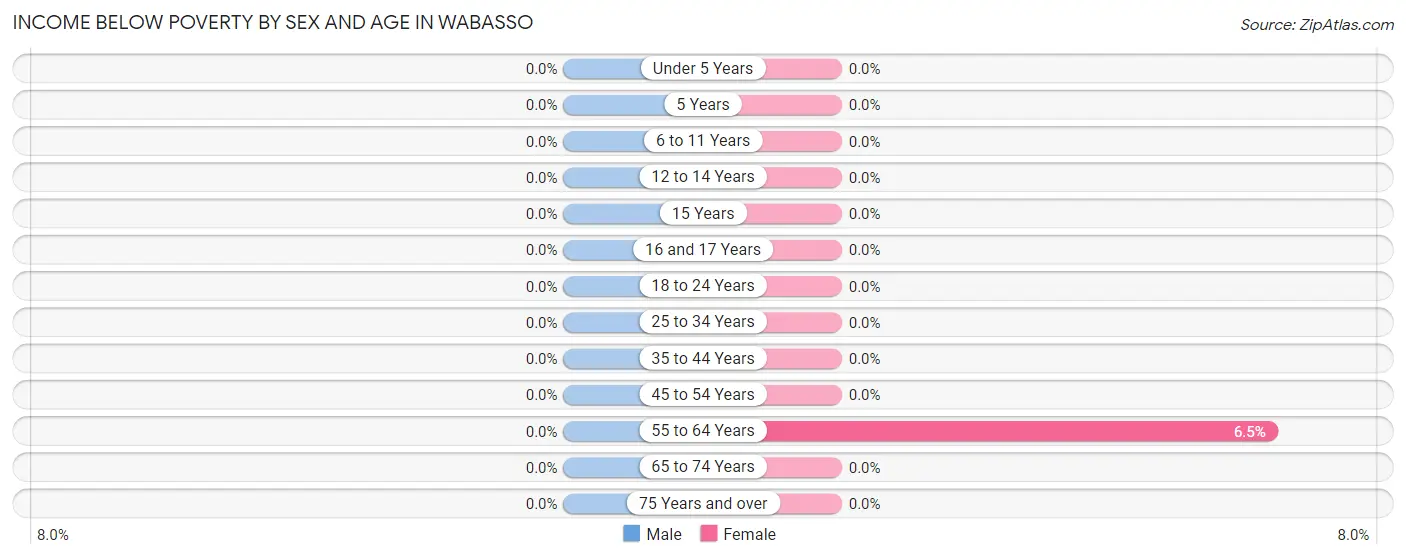
| Age Bracket | Male | Female |
| Under 5 Years | 0 (0.0%) | 0 (0.0%) |
| 5 Years | 0 (0.0%) | 0 (0.0%) |
| 6 to 11 Years | 0 (0.0%) | 0 (0.0%) |
| 12 to 14 Years | 0 (0.0%) | 0 (0.0%) |
| 15 Years | 0 (0.0%) | 0 (0.0%) |
| 16 and 17 Years | 0 (0.0%) | 0 (0.0%) |
| 18 to 24 Years | 0 (0.0%) | 0 (0.0%) |
| 25 to 34 Years | 0 (0.0%) | 0 (0.0%) |
| 35 to 44 Years | 0 (0.0%) | 0 (0.0%) |
| 45 to 54 Years | 0 (0.0%) | 0 (0.0%) |
| 55 to 64 Years | 0 (0.0%) | 11 (6.5%) |
| 65 to 74 Years | 0 (0.0%) | 0 (0.0%) |
| 75 Years and over | 0 (0.0%) | 0 (0.0%) |
| Total | 0 (0.0%) | 11 (1.6%) |
Income Above Poverty by Sex and Age in Wabasso
According to the poverty statistics in Wabasso, males aged 6 to 11 years and females aged 6 to 11 years are the age groups that are most secure financially, with 100.0% of males and 100.0% of females in these age groups living above the poverty line.
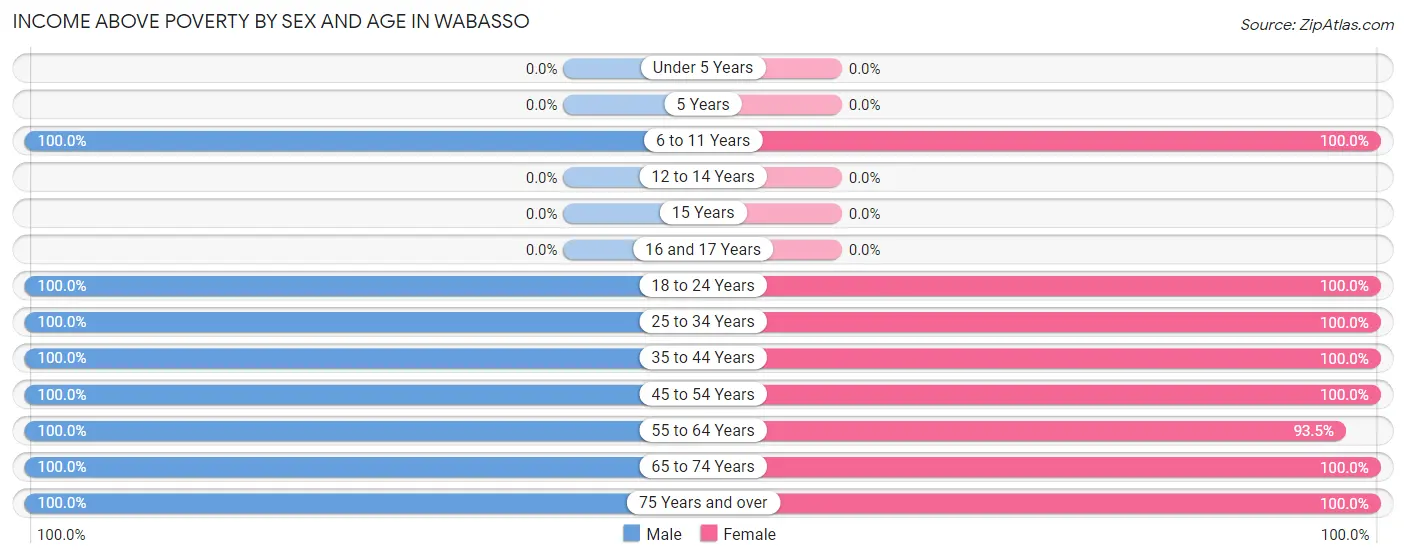
| Age Bracket | Male | Female |
| Under 5 Years | 0 (0.0%) | 0 (0.0%) |
| 5 Years | 0 (0.0%) | 0 (0.0%) |
| 6 to 11 Years | 24 (100.0%) | 107 (100.0%) |
| 12 to 14 Years | 0 (0.0%) | 0 (0.0%) |
| 15 Years | 0 (0.0%) | 0 (0.0%) |
| 16 and 17 Years | 0 (0.0%) | 0 (0.0%) |
| 18 to 24 Years | 16 (100.0%) | 67 (100.0%) |
| 25 to 34 Years | 112 (100.0%) | 7 (100.0%) |
| 35 to 44 Years | 9 (100.0%) | 24 (100.0%) |
| 45 to 54 Years | 59 (100.0%) | 81 (100.0%) |
| 55 to 64 Years | 162 (100.0%) | 159 (93.5%) |
| 65 to 74 Years | 73 (100.0%) | 90 (100.0%) |
| 75 Years and over | 49 (100.0%) | 129 (100.0%) |
| Total | 504 (100.0%) | 664 (98.4%) |
Income Below Poverty Among Married-Couple Families in Wabasso
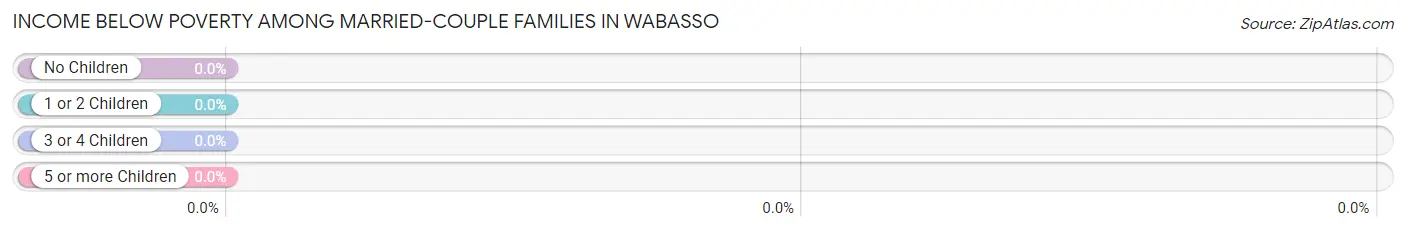
| Children | Above Poverty | Below Poverty |
| No Children | 220 (100.0%) | 0 (0.0%) |
| 1 or 2 Children | 0 (0.0%) | 0 (0.0%) |
| 3 or 4 Children | 0 (0.0%) | 0 (0.0%) |
| 5 or more Children | 0 (0.0%) | 0 (0.0%) |
| Total | 220 (100.0%) | 0 (0.0%) |
Income Below Poverty Among Single-Parent Households in Wabasso
| Children | Single Father | Single Mother |
| No Children | 0 (0.0%) | 0 (0.0%) |
| 1 or 2 Children | 0 (0.0%) | 0 (0.0%) |
| 3 or 4 Children | 0 (0.0%) | 0 (0.0%) |
| 5 or more Children | 0 (0.0%) | 0 (0.0%) |
| Total | 0 (0.0%) | 0 (0.0%) |
Income Below Poverty Among Married-Couple vs Single-Parent Households in Wabasso
| Children | Married-Couple Families | Single-Parent Households |
| No Children | 0 (0.0%) | 0 (0.0%) |
| 1 or 2 Children | 0 (0.0%) | 0 (0.0%) |
| 3 or 4 Children | 0 (0.0%) | 0 (0.0%) |
| 5 or more Children | 0 (0.0%) | 0 (0.0%) |
| Total | 0 (0.0%) | 0 (0.0%) |
Race in Wabasso
The most populous races in Wabasso are Black / African American (470 | 39.9%), White / Caucasian (446 | 37.8%), and Two or more Races (263 | 22.3%).
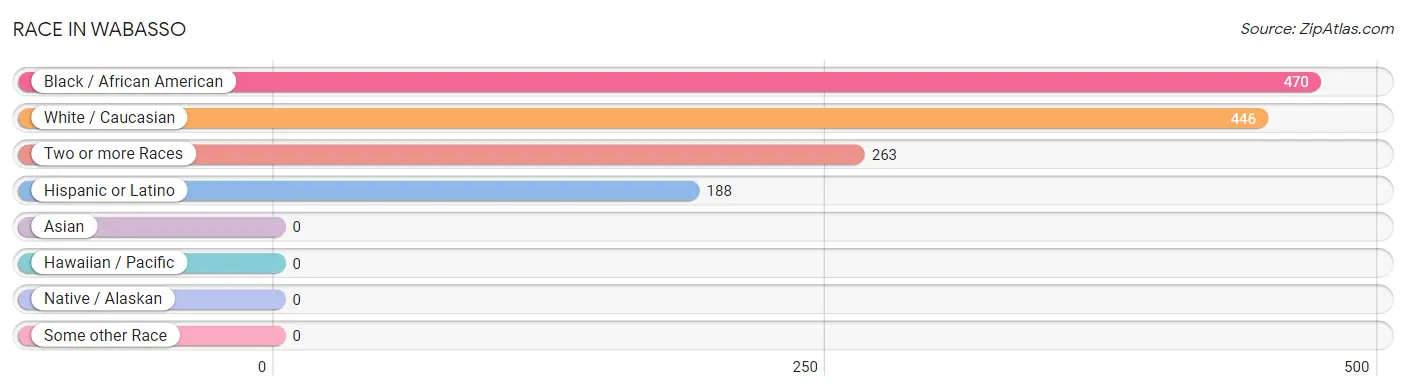
| Race | # Population | % Population |
| Asian | 0 | 0.0% |
| Black / African American | 470 | 39.9% |
| Hawaiian / Pacific | 0 | 0.0% |
| Hispanic or Latino | 188 | 16.0% |
| Native / Alaskan | 0 | 0.0% |
| White / Caucasian | 446 | 37.8% |
| Two or more Races | 263 | 22.3% |
| Some other Race | 0 | 0.0% |
| Total | 1,179 | 100.0% |
Ancestry in Wabasso
The most populous ancestries reported in Wabasso are Irish (152 | 12.9%), Cuban (140 | 11.9%), American (121 | 10.3%), German (102 | 8.6%), and Mexican (48 | 4.1%), together accounting for 47.7% of all Wabasso residents.
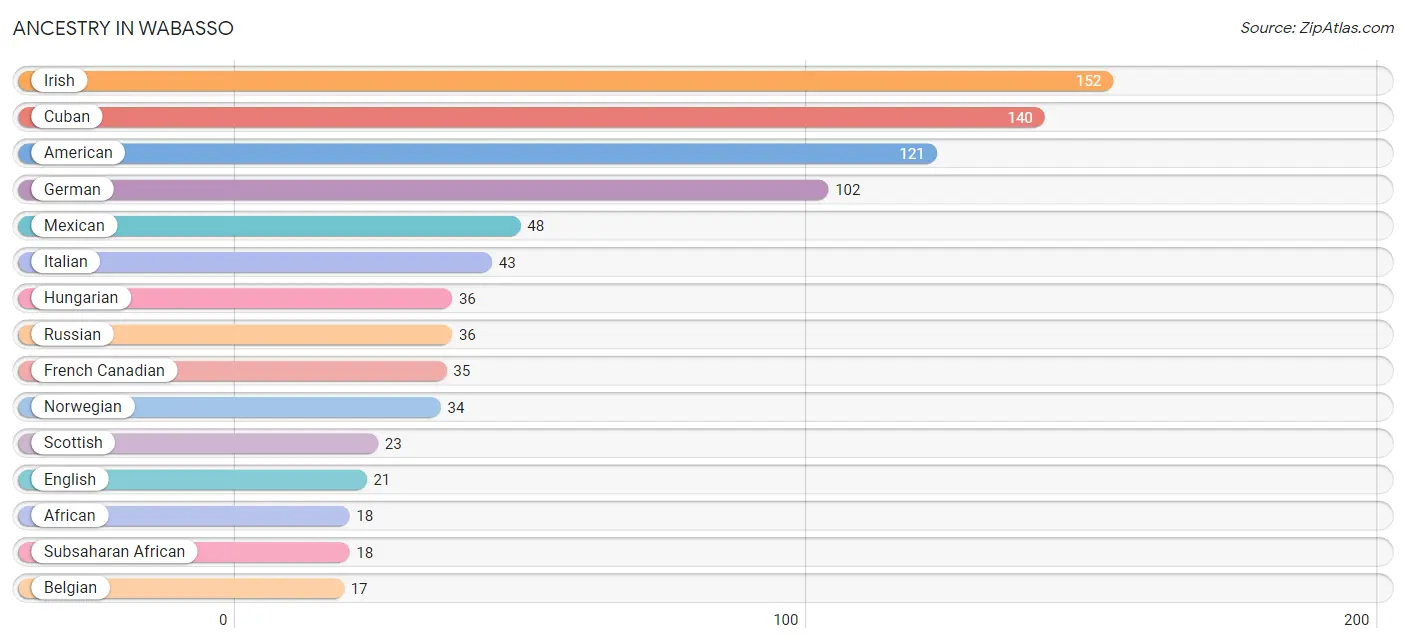
| Ancestry | # Population | % Population |
| African | 18 | 1.5% |
| American | 121 | 10.3% |
| Belgian | 17 | 1.4% |
| Canadian | 11 | 0.9% |
| Cuban | 140 | 11.9% |
| English | 21 | 1.8% |
| French | 12 | 1.0% |
| French Canadian | 35 | 3.0% |
| German | 102 | 8.6% |
| Hungarian | 36 | 3.0% |
| Irish | 152 | 12.9% |
| Italian | 43 | 3.6% |
| Mexican | 48 | 4.1% |
| Norwegian | 34 | 2.9% |
| Russian | 36 | 3.0% |
| Scottish | 23 | 1.9% |
| Subsaharan African | 18 | 1.5% | View All 17 Rows |
Immigrants in Wabasso
The most numerous immigrant groups reported in Wabasso came from Latin America (181 | 15.3%), Caribbean (157 | 13.3%), Cuba (140 | 11.9%), Central America (24 | 2.0%), and Mexico (24 | 2.0%), together accounting for 44.6% of all Wabasso residents.
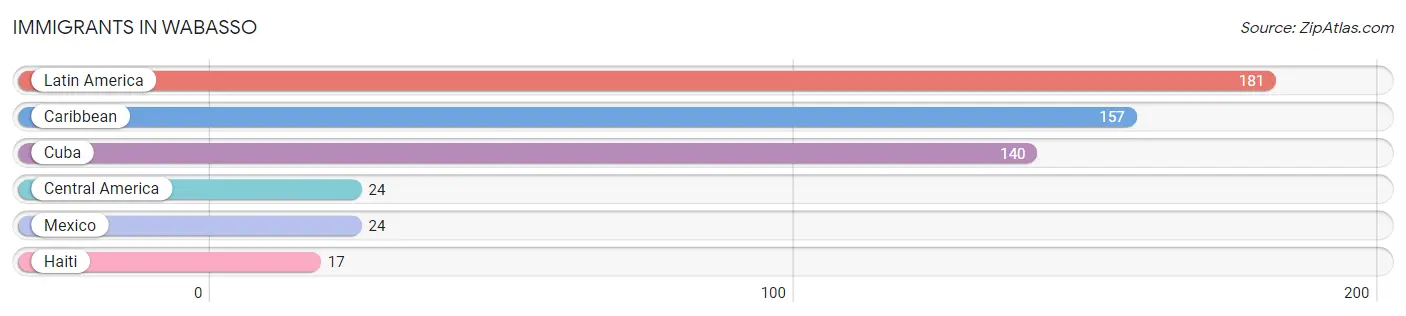
| Immigration Origin | # Population | % Population |
| Caribbean | 157 | 13.3% |
| Central America | 24 | 2.0% |
| Cuba | 140 | 11.9% |
| Haiti | 17 | 1.4% |
| Latin America | 181 | 15.3% |
| Mexico | 24 | 2.0% | View All 6 Rows |
Sex and Age in Wabasso
Sex and Age in Wabasso
The most populous age groups in Wabasso are 25 to 29 Years (112 | 22.2%) for men and 5 to 9 Years (107 | 15.9%) for women.
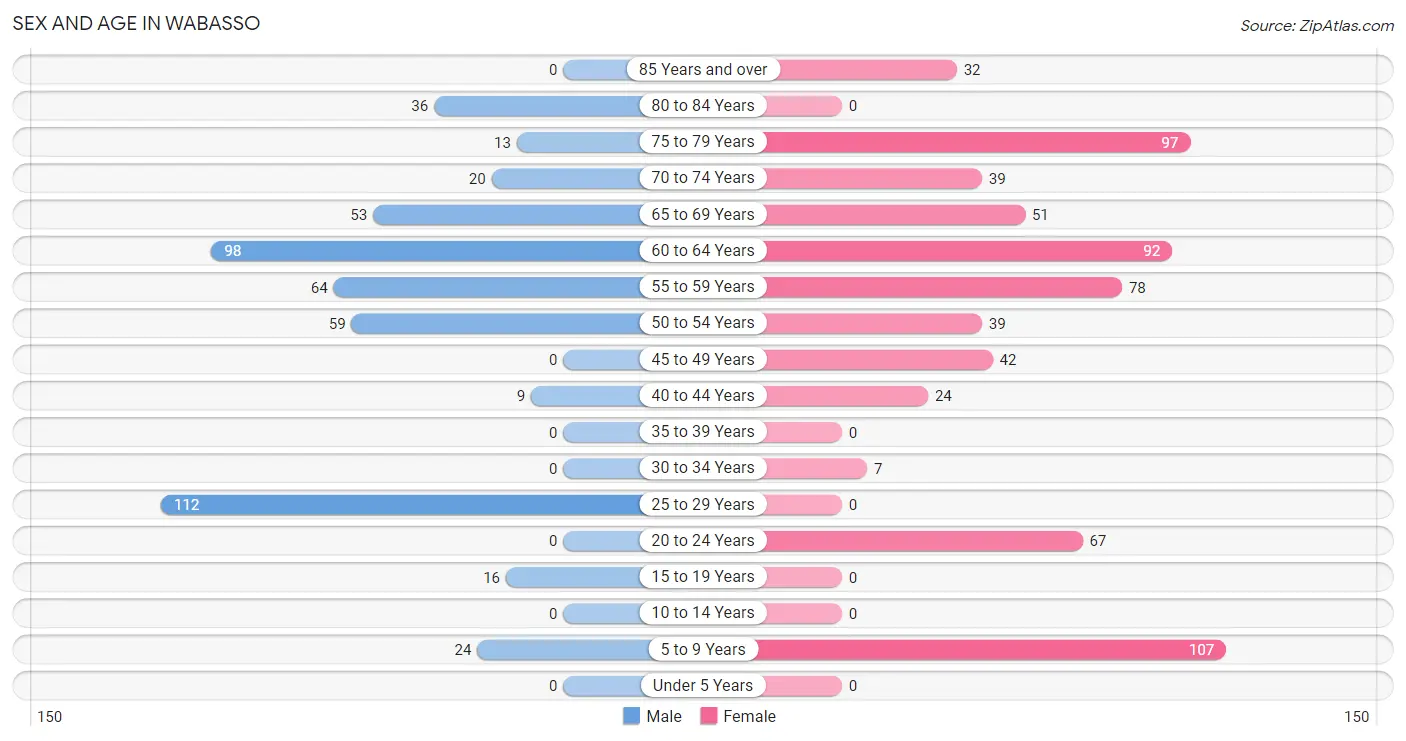
| Age Bracket | Male | Female |
| Under 5 Years | 0 (0.0%) | 0 (0.0%) |
| 5 to 9 Years | 24 (4.8%) | 107 (15.9%) |
| 10 to 14 Years | 0 (0.0%) | 0 (0.0%) |
| 15 to 19 Years | 16 (3.2%) | 0 (0.0%) |
| 20 to 24 Years | 0 (0.0%) | 67 (9.9%) |
| 25 to 29 Years | 112 (22.2%) | 0 (0.0%) |
| 30 to 34 Years | 0 (0.0%) | 7 (1.0%) |
| 35 to 39 Years | 0 (0.0%) | 0 (0.0%) |
| 40 to 44 Years | 9 (1.8%) | 24 (3.6%) |
| 45 to 49 Years | 0 (0.0%) | 42 (6.2%) |
| 50 to 54 Years | 59 (11.7%) | 39 (5.8%) |
| 55 to 59 Years | 64 (12.7%) | 78 (11.6%) |
| 60 to 64 Years | 98 (19.4%) | 92 (13.6%) |
| 65 to 69 Years | 53 (10.5%) | 51 (7.6%) |
| 70 to 74 Years | 20 (4.0%) | 39 (5.8%) |
| 75 to 79 Years | 13 (2.6%) | 97 (14.4%) |
| 80 to 84 Years | 36 (7.1%) | 0 (0.0%) |
| 85 Years and over | 0 (0.0%) | 32 (4.7%) |
| Total | 504 (100.0%) | 675 (100.0%) |
Families and Households in Wabasso
Median Family Size in Wabasso
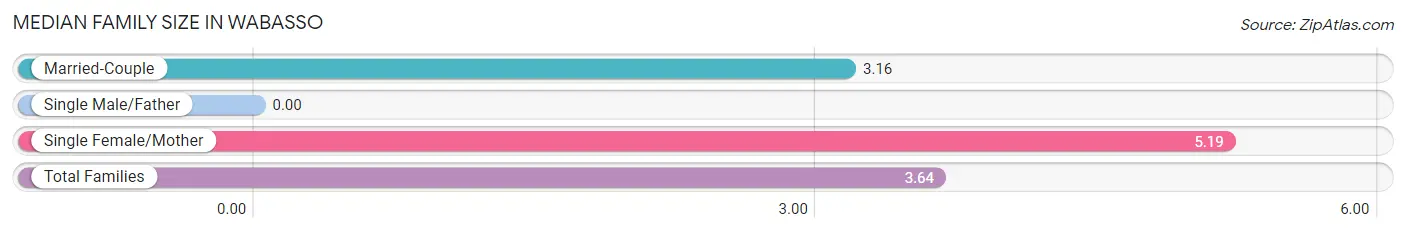
| Family Type | # Families | Family Size |
| Married-Couple | 220 (76.4%) | 3.16 |
| Single Male/Father | 0 (0.0%) | - |
| Single Female/Mother | 68 (23.6%) | 5.19 |
| Total Families | 288 (100.0%) | 3.64 |
Median Household Size in Wabasso
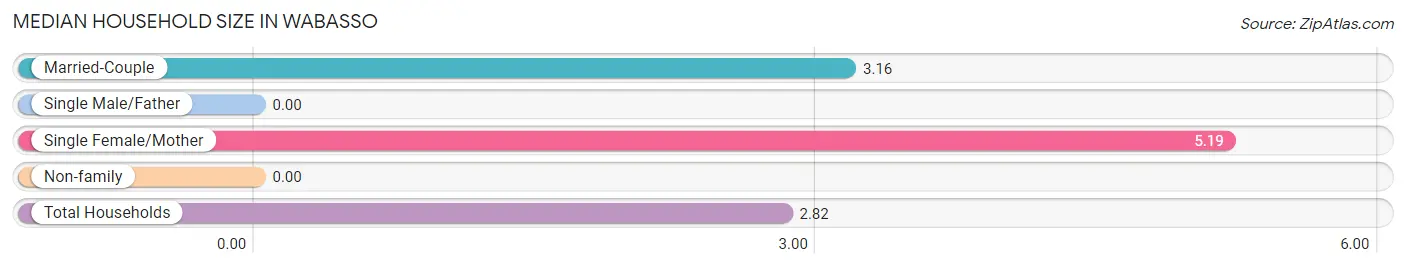
| Household Type | # Households | Household Size |
| Married-Couple | 220 (52.6%) | 3.16 |
| Single Male/Father | 0 (0.0%) | - |
| Single Female/Mother | 68 (16.3%) | 5.19 |
| Non-family | 130 (31.1%) | - |
| Total Households | 418 (100.0%) | 2.82 |
Household Size by Marriage Status in Wabasso
Out of a total of 418 households in Wabasso, 288 (68.9%) are family households, while 130 (31.1%) are nonfamily households. The most numerous type of family households are 2-person households, comprising 173, and the most common type of nonfamily households are 1-person households, comprising 130.
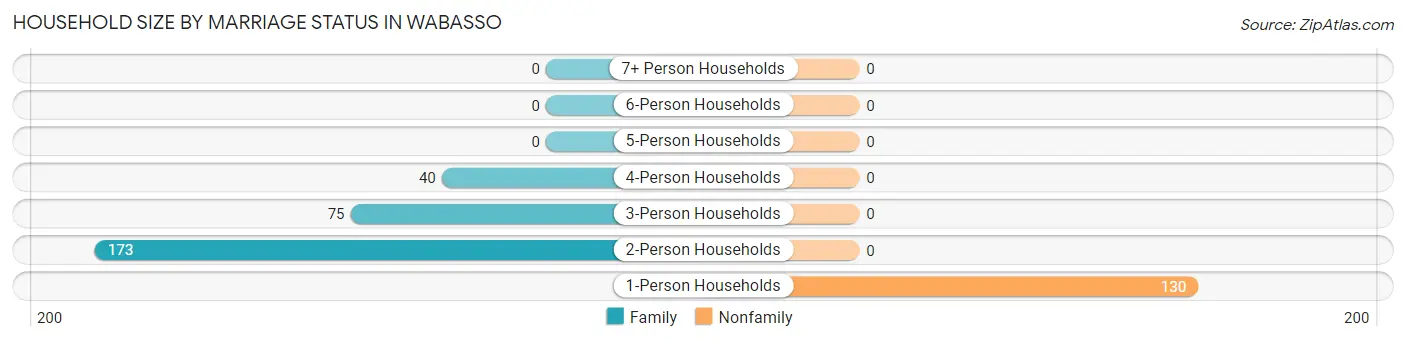
| Household Size | Family Households | Nonfamily Households |
| 1-Person Households | - | 130 (31.1%) |
| 2-Person Households | 173 (41.4%) | 0 (0.0%) |
| 3-Person Households | 75 (17.9%) | 0 (0.0%) |
| 4-Person Households | 40 (9.6%) | 0 (0.0%) |
| 5-Person Households | 0 (0.0%) | 0 (0.0%) |
| 6-Person Households | 0 (0.0%) | 0 (0.0%) |
| 7+ Person Households | 0 (0.0%) | 0 (0.0%) |
| Total | 288 (68.9%) | 130 (31.1%) |
Female Fertility in Wabasso
Fertility by Age in Wabasso
| Age Bracket | Women with Births | Births / 1,000 Women |
| 15 to 19 years | 0 (0.0%) | 0.0 |
| 20 to 34 years | 0 (0.0%) | 0.0 |
| 35 to 50 years | 0 (0.0%) | 0.0 |
| Total | 0 (0.0%) | 0.0 |
Fertility by Age by Marriage Status in Wabasso
| Age Bracket | Married | Unmarried |
| 15 to 19 years | 0 (0.0%) | 0 (0.0%) |
| 20 to 34 years | 0 (0.0%) | 0 (0.0%) |
| 35 to 50 years | 0 (0.0%) | 0 (0.0%) |
| Total | 0 (0.0%) | 0 (0.0%) |
Fertility by Education in Wabasso
| Educational Attainment | Women with Births | Births / 1,000 Women |
| Less than High School | 0 (0.0%) | 0.0 |
| High School Diploma | 0 (0.0%) | 0.0 |
| College or Associate's Degree | 0 (0.0%) | 0.0 |
| Bachelor's Degree | 0 (0.0%) | 0.0 |
| Graduate Degree | 0 (0.0%) | 0.0 |
| Total | 0 (0.0%) | 0.0 |
Fertility by Education by Marriage Status in Wabasso
| Educational Attainment | Married | Unmarried |
| Less than High School | 0 (0.0%) | 0 (0.0%) |
| High School Diploma | 0 (0.0%) | 0 (0.0%) |
| College or Associate's Degree | 0 (0.0%) | 0 (0.0%) |
| Bachelor's Degree | 0 (0.0%) | 0 (0.0%) |
| Graduate Degree | 0 (0.0%) | 0 (0.0%) |
| Total | 0 (0.0%) | 0 (0.0%) |
Employment Characteristics in Wabasso
Employment by Class of Employer in Wabasso
Among the 580 employed individuals in Wabasso, private company employees (483 | 83.3%), local government employees (31 | 5.3%), and state government employees (24 | 4.1%) make up the most common classes of employment.
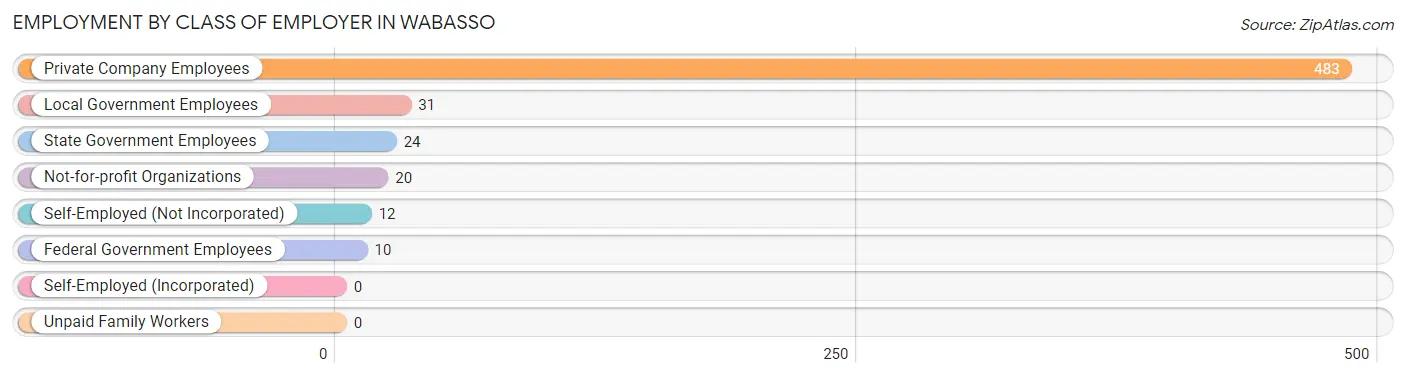
| Employer Class | # Employees | % Employees |
| Private Company Employees | 483 | 83.3% |
| Self-Employed (Incorporated) | 0 | 0.0% |
| Self-Employed (Not Incorporated) | 12 | 2.1% |
| Not-for-profit Organizations | 20 | 3.5% |
| Local Government Employees | 31 | 5.3% |
| State Government Employees | 24 | 4.1% |
| Federal Government Employees | 10 | 1.7% |
| Unpaid Family Workers | 0 | 0.0% |
| Total | 580 | 100.0% |
Employment Status by Age in Wabasso
According to the labor force statistics for Wabasso, out of the total population over 16 years of age (1,048), 56.4% or 591 individuals are in the labor force, with 1.9% or 11 of them unemployed. The age group with the highest labor force participation rate is 16 to 19 years, with 100.0% or 16 individuals in the labor force. Within the labor force, the 55 to 59 years age range has the highest percentage of unemployed individuals, with 11.6% or 11 of them being unemployed.
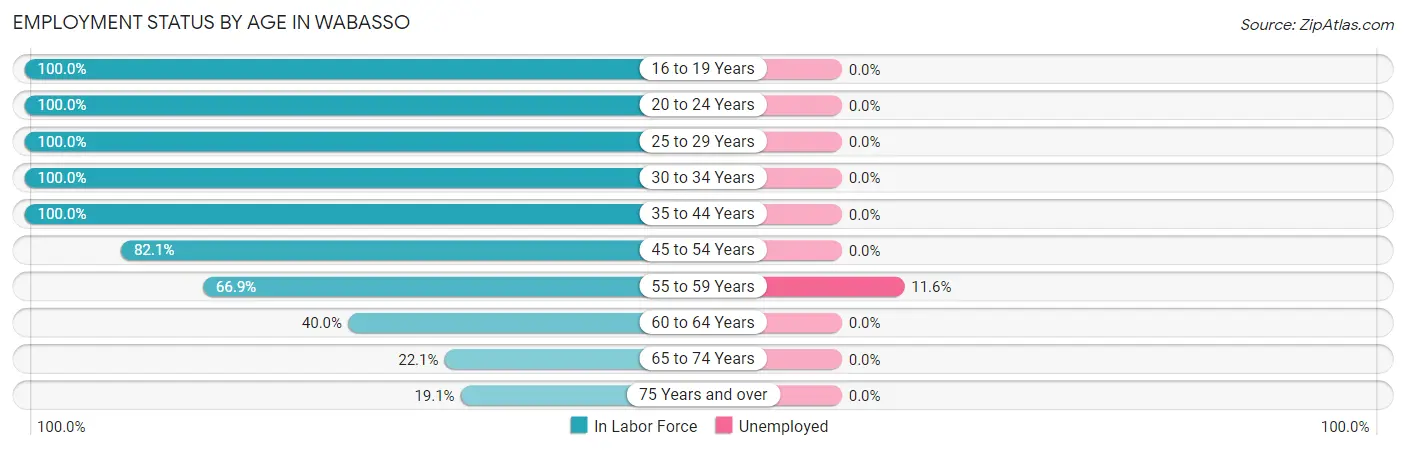
| Age Bracket | In Labor Force | Unemployed |
| 16 to 19 Years | 16 (100.0%) | 0 (0.0%) |
| 20 to 24 Years | 67 (100.0%) | 0 (0.0%) |
| 25 to 29 Years | 112 (100.0%) | 0 (0.0%) |
| 30 to 34 Years | 7 (100.0%) | 0 (0.0%) |
| 35 to 44 Years | 33 (100.0%) | 0 (0.0%) |
| 45 to 54 Years | 115 (82.1%) | 0 (0.0%) |
| 55 to 59 Years | 95 (66.9%) | 11 (11.6%) |
| 60 to 64 Years | 76 (40.0%) | 0 (0.0%) |
| 65 to 74 Years | 36 (22.1%) | 0 (0.0%) |
| 75 Years and over | 34 (19.1%) | 0 (0.0%) |
| Total | 591 (56.4%) | 11 (1.9%) |
Employment Status by Educational Attainment in Wabasso
According to labor force statistics for Wabasso, 70.2% of individuals (438) out of the total population between 25 and 64 years of age (624) are in the labor force, with 2.5% or 11 of them being unemployed. The group with the highest labor force participation rate are those with the educational attainment of bachelor's degree or higher, with 100.0% or 165 individuals in the labor force. Within the labor force, individuals with college / associate degree education have the highest percentage of unemployment, with 5.3% or 11 of them being unemployed.
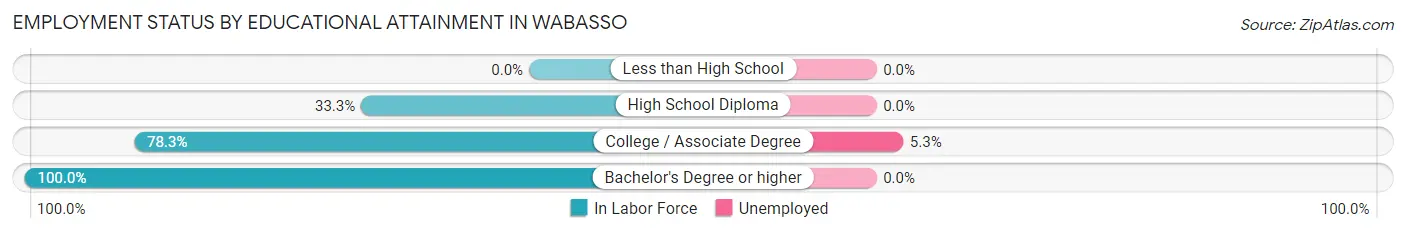
| Educational Attainment | In Labor Force | Unemployed |
| Less than High School | 0 (0.0%) | 0 (0.0%) |
| High School Diploma | 64 (33.3%) | 0 (0.0%) |
| College / Associate Degree | 209 (78.3%) | 14 (5.3%) |
| Bachelor's Degree or higher | 165 (100.0%) | 0 (0.0%) |
| Total | 438 (70.2%) | 16 (2.5%) |
Employment Occupations by Sex in Wabasso
Management, Business, Science and Arts Occupations
The most common Management, Business, Science and Arts occupations in Wabasso are Community & Social Service (109 | 18.8%), Arts, Media & Entertainment (85 | 14.7%), Management (43 | 7.4%), Health Diagnosing & Treating (42 | 7.2%), and Health Technologists (42 | 7.2%).
Management, Business, Science and Arts Occupations by Sex
Within the Management, Business, Science and Arts occupations in Wabasso, the most male-oriented occupations are Health Diagnosing & Treating (28.6%), Health Technologists (28.6%), and Arts, Media & Entertainment (21.2%), while the most female-oriented occupations are Computers, Engineering & Science (100.0%), Computers & Mathematics (100.0%), and Education, Arts & Media (100.0%).
| Occupation | Male | Female |
| Management | 9 (20.9%) | 34 (79.1%) |
| Business & Financial | 0 (0.0%) | 0 (0.0%) |
| Computers, Engineering & Science | 0 (0.0%) | 14 (100.0%) |
| Computers & Mathematics | 0 (0.0%) | 14 (100.0%) |
| Architecture & Engineering | 0 (0.0%) | 0 (0.0%) |
| Life, Physical & Social Science | 0 (0.0%) | 0 (0.0%) |
| Community & Social Service | 18 (16.5%) | 91 (83.5%) |
| Education, Arts & Media | 0 (0.0%) | 17 (100.0%) |
| Legal Services & Support | 0 (0.0%) | 0 (0.0%) |
| Education Instruction & Library | 0 (0.0%) | 7 (100.0%) |
| Arts, Media & Entertainment | 18 (21.2%) | 67 (78.8%) |
| Health Diagnosing & Treating | 12 (28.6%) | 30 (71.4%) |
| Health Technologists | 12 (28.6%) | 30 (71.4%) |
| Total (Category) | 39 (18.8%) | 169 (81.2%) |
| Total (Overall) | 302 (52.1%) | 278 (47.9%) |
Services Occupations
The most common Services occupations in Wabasso are Cleaning & Maintenance (90 | 15.5%), Personal Care & Service (78 | 13.5%), and Healthcare Support (30 | 5.2%).
Services Occupations by Sex
Within the Services occupations in Wabasso, the most male-oriented occupations are Personal Care & Service (62.8%), Healthcare Support (60.0%), and Cleaning & Maintenance (51.1%), while the most female-oriented occupations are Cleaning & Maintenance (48.9%), Healthcare Support (40.0%), and Personal Care & Service (37.2%).
| Occupation | Male | Female |
| Healthcare Support | 18 (60.0%) | 12 (40.0%) |
| Security & Protection | 0 (0.0%) | 0 (0.0%) |
| Firefighting & Prevention | 0 (0.0%) | 0 (0.0%) |
| Law Enforcement | 0 (0.0%) | 0 (0.0%) |
| Food Preparation & Serving | 0 (0.0%) | 0 (0.0%) |
| Cleaning & Maintenance | 46 (51.1%) | 44 (48.9%) |
| Personal Care & Service | 49 (62.8%) | 29 (37.2%) |
| Total (Category) | 113 (57.1%) | 85 (42.9%) |
| Total (Overall) | 302 (52.1%) | 278 (47.9%) |
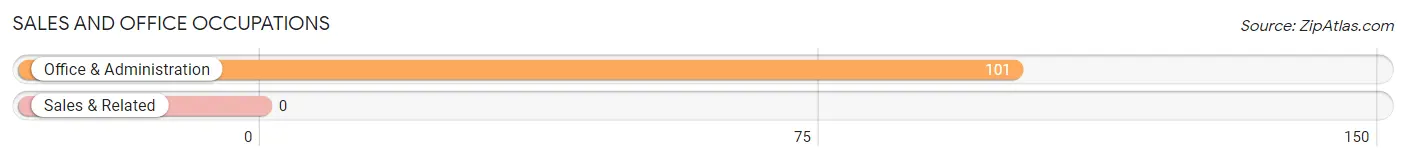
Sales and Office Occupations
The most common Sales and Office occupations in Wabasso are , and Office & Administration (101 | 17.4%).
Sales and Office Occupations by Sex
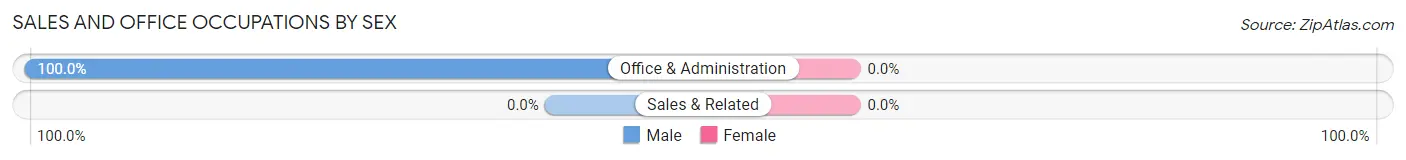
| Occupation | Male | Female |
| Sales & Related | 0 (0.0%) | 0 (0.0%) |
| Office & Administration | 101 (100.0%) | 0 (0.0%) |
| Total (Category) | 101 (100.0%) | 0 (0.0%) |
| Total (Overall) | 302 (52.1%) | 278 (47.9%) |
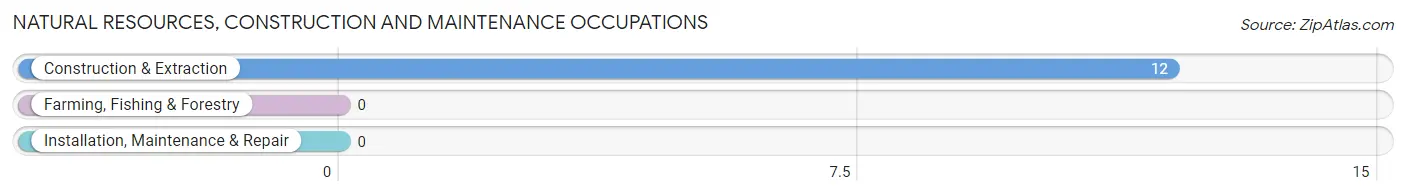
Natural Resources, Construction and Maintenance Occupations
The most common Natural Resources, Construction and Maintenance occupations in Wabasso are , and Construction & Extraction (12 | 2.1%).
Natural Resources, Construction and Maintenance Occupations by Sex
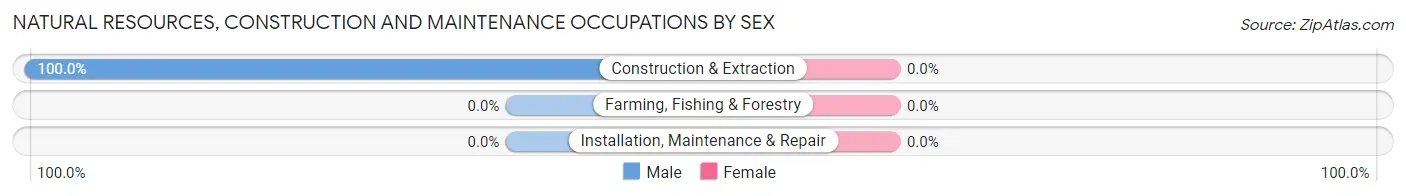
| Occupation | Male | Female |
| Farming, Fishing & Forestry | 0 (0.0%) | 0 (0.0%) |
| Construction & Extraction | 12 (100.0%) | 0 (0.0%) |
| Installation, Maintenance & Repair | 0 (0.0%) | 0 (0.0%) |
| Total (Category) | 12 (100.0%) | 0 (0.0%) |
| Total (Overall) | 302 (52.1%) | 278 (47.9%) |
Production, Transportation and Moving Occupations
The most common Production, Transportation and Moving occupations in Wabasso are Production (24 | 4.1%), Transportation (21 | 3.6%), and Material Moving (16 | 2.8%).
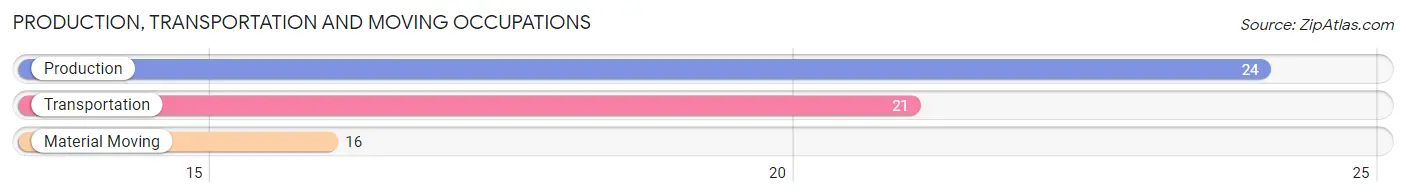
Production, Transportation and Moving Occupations by Sex
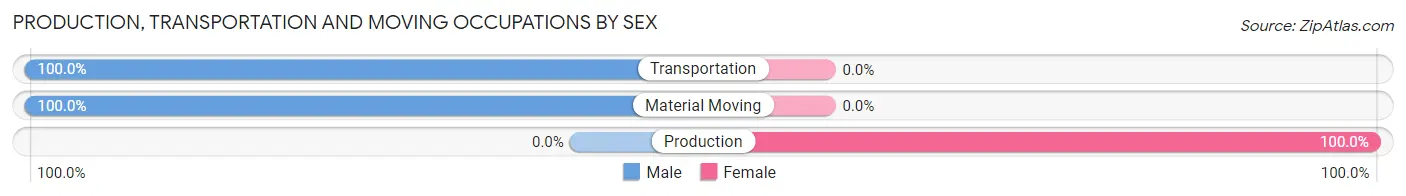
| Occupation | Male | Female |
| Production | 0 (0.0%) | 24 (100.0%) |
| Transportation | 21 (100.0%) | 0 (0.0%) |
| Material Moving | 16 (100.0%) | 0 (0.0%) |
| Total (Category) | 37 (60.7%) | 24 (39.3%) |
| Total (Overall) | 302 (52.1%) | 278 (47.9%) |
Employment Industries by Sex in Wabasso
Employment Industries in Wabasso
The major employment industries in Wabasso include Health Care & Social Assistance (120 | 20.7%), Professional & Scientific (91 | 15.7%), Educational Services (91 | 15.7%), Administrative & Support (70 | 12.1%), and Arts, Entertainment & Recreation (31 | 5.3%).
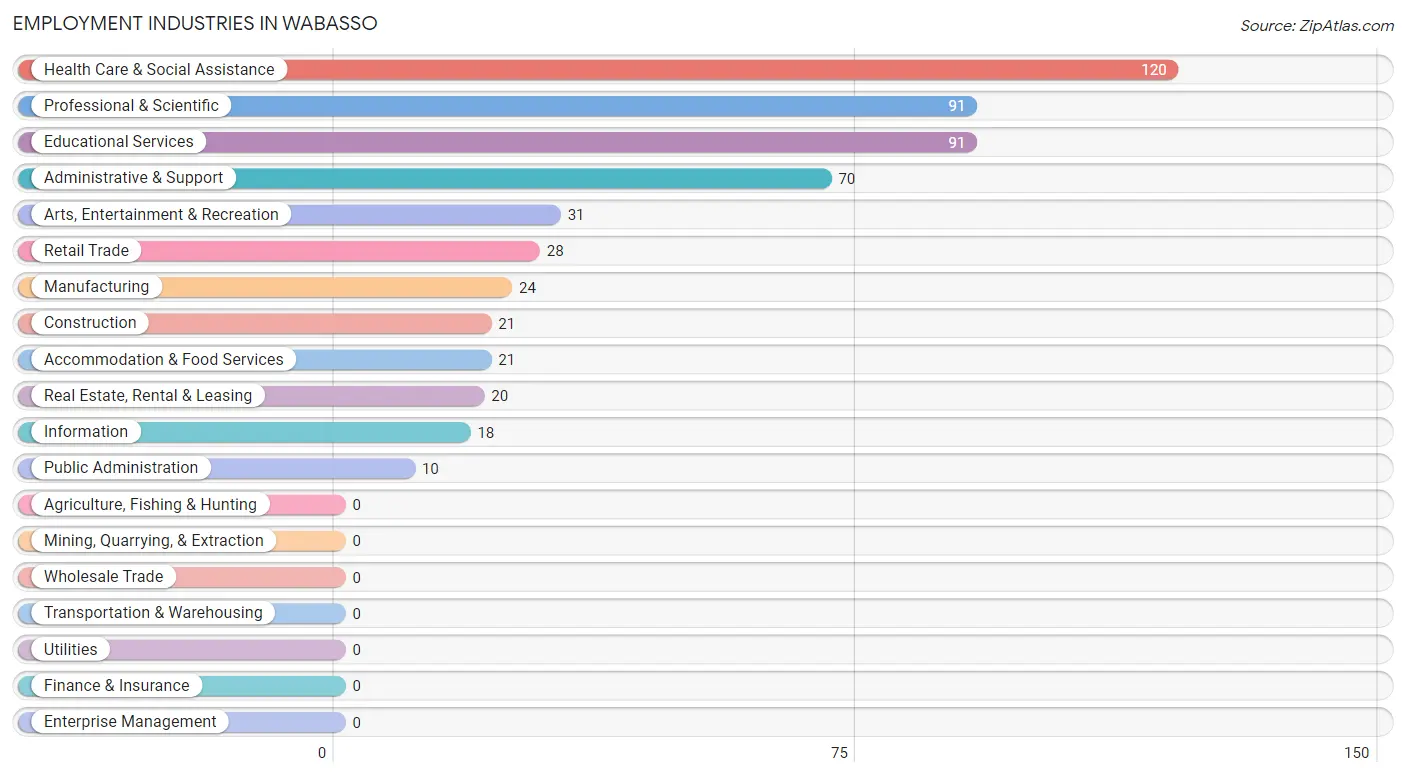
Employment Industries by Sex in Wabasso
The Wabasso industries that see more men than women are Construction (100.0%), Information (100.0%), and Professional & Scientific (100.0%), whereas the industries that tend to have a higher number of women are Manufacturing (100.0%), Real Estate, Rental & Leasing (100.0%), and Educational Services (100.0%).
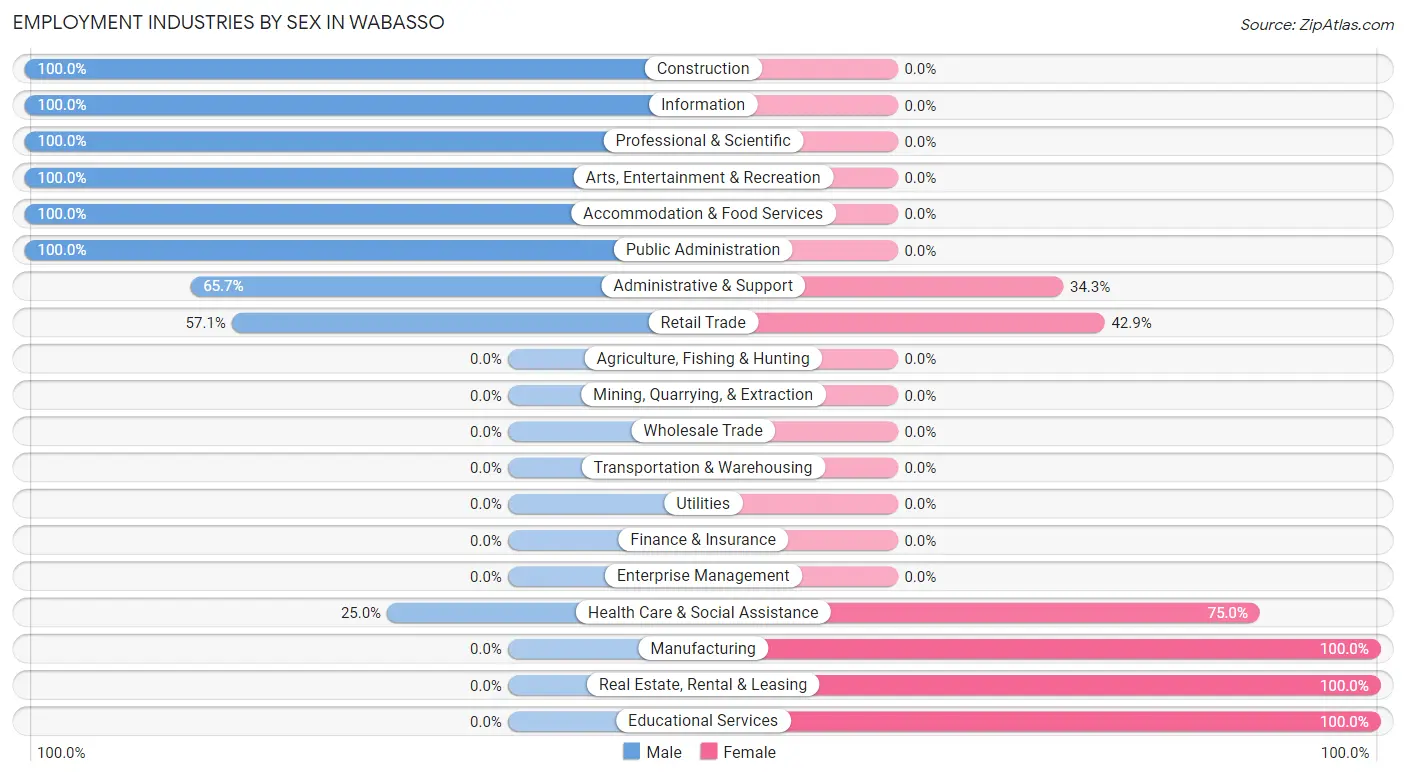
| Industry | Male | Female |
| Agriculture, Fishing & Hunting | 0 (0.0%) | 0 (0.0%) |
| Mining, Quarrying, & Extraction | 0 (0.0%) | 0 (0.0%) |
| Construction | 21 (100.0%) | 0 (0.0%) |
| Manufacturing | 0 (0.0%) | 24 (100.0%) |
| Wholesale Trade | 0 (0.0%) | 0 (0.0%) |
| Retail Trade | 16 (57.1%) | 12 (42.9%) |
| Transportation & Warehousing | 0 (0.0%) | 0 (0.0%) |
| Utilities | 0 (0.0%) | 0 (0.0%) |
| Information | 18 (100.0%) | 0 (0.0%) |
| Finance & Insurance | 0 (0.0%) | 0 (0.0%) |
| Real Estate, Rental & Leasing | 0 (0.0%) | 20 (100.0%) |
| Professional & Scientific | 91 (100.0%) | 0 (0.0%) |
| Enterprise Management | 0 (0.0%) | 0 (0.0%) |
| Administrative & Support | 46 (65.7%) | 24 (34.3%) |
| Educational Services | 0 (0.0%) | 91 (100.0%) |
| Health Care & Social Assistance | 30 (25.0%) | 90 (75.0%) |
| Arts, Entertainment & Recreation | 31 (100.0%) | 0 (0.0%) |
| Accommodation & Food Services | 21 (100.0%) | 0 (0.0%) |
| Public Administration | 10 (100.0%) | 0 (0.0%) |
| Total | 302 (52.1%) | 278 (47.9%) |
Education in Wabasso
School Enrollment in Wabasso
The most common levels of schooling among the 131 students in Wabasso are college / undergraduate (91 | 69.5%), elementary school (24 | 18.3%), and graduate / professional (16 | 12.2%).
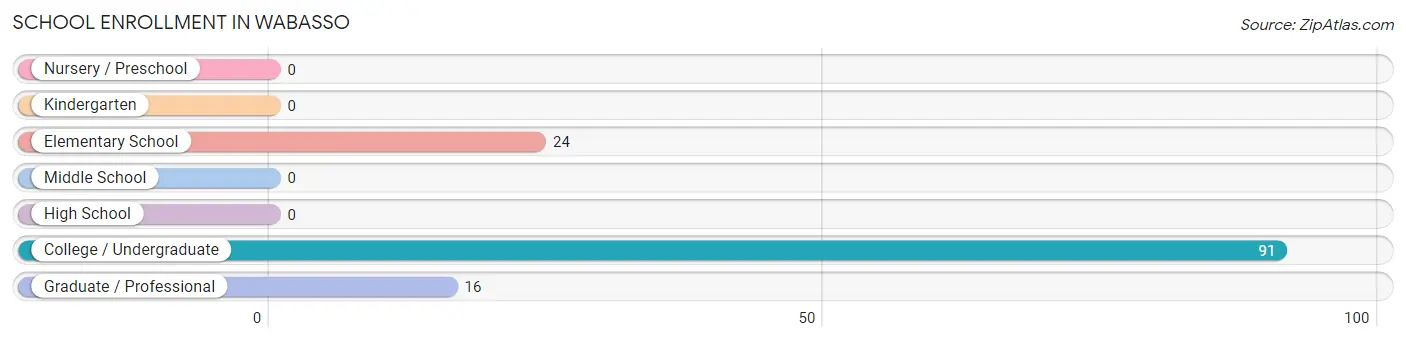
| School Level | # Students | % Students |
| Nursery / Preschool | 0 | 0.0% |
| Kindergarten | 0 | 0.0% |
| Elementary School | 24 | 18.3% |
| Middle School | 0 | 0.0% |
| High School | 0 | 0.0% |
| College / Undergraduate | 91 | 69.5% |
| Graduate / Professional | 16 | 12.2% |
| Total | 131 | 100.0% |
School Enrollment by Age by Funding Source in Wabasso
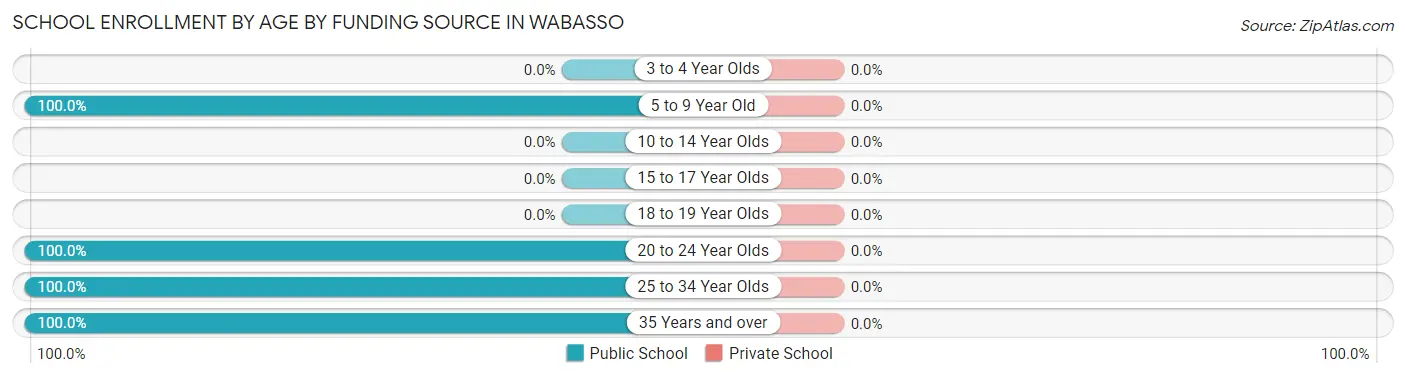
| Age Bracket | Public School | Private School |
| 3 to 4 Year Olds | 0 (0.0%) | 0 (0.0%) |
| 5 to 9 Year Old | 24 (100.0%) | 0 (0.0%) |
| 10 to 14 Year Olds | 0 (0.0%) | 0 (0.0%) |
| 15 to 17 Year Olds | 0 (0.0%) | 0 (0.0%) |
| 18 to 19 Year Olds | 0 (0.0%) | 0 (0.0%) |
| 20 to 24 Year Olds | 67 (100.0%) | 0 (0.0%) |
| 25 to 34 Year Olds | 7 (100.0%) | 0 (0.0%) |
| 35 Years and over | 33 (100.0%) | 0 (0.0%) |
| Total | 131 (100.0%) | 0 (0.0%) |
Educational Attainment by Field of Study in Wabasso
Social sciences (91 | 30.0%), business (83 | 27.4%), science & technology (74 | 24.4%), physical & health sciences (21 | 6.9%), and education (17 | 5.6%) are the most common fields of study among 303 individuals in Wabasso who have obtained a bachelor's degree or higher.
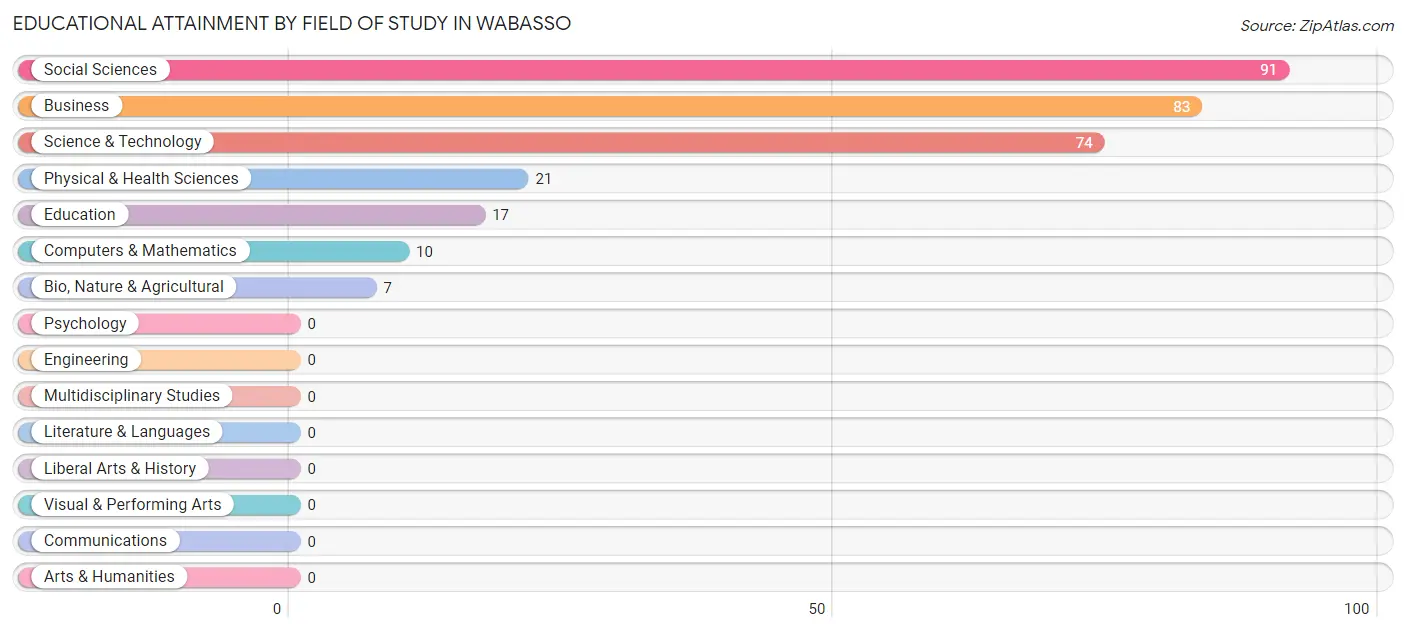
| Field of Study | # Graduates | % Graduates |
| Computers & Mathematics | 10 | 3.3% |
| Bio, Nature & Agricultural | 7 | 2.3% |
| Physical & Health Sciences | 21 | 6.9% |
| Psychology | 0 | 0.0% |
| Social Sciences | 91 | 30.0% |
| Engineering | 0 | 0.0% |
| Multidisciplinary Studies | 0 | 0.0% |
| Science & Technology | 74 | 24.4% |
| Business | 83 | 27.4% |
| Education | 17 | 5.6% |
| Literature & Languages | 0 | 0.0% |
| Liberal Arts & History | 0 | 0.0% |
| Visual & Performing Arts | 0 | 0.0% |
| Communications | 0 | 0.0% |
| Arts & Humanities | 0 | 0.0% |
| Total | 303 | 100.0% |
Transportation & Commute in Wabasso
Vehicle Availability by Sex in Wabasso
The most prevalent vehicle ownership categories in Wabasso are males with 2 vehicles (130, accounting for 43.0%) and females with 2 vehicles (80, making up 46.8%).
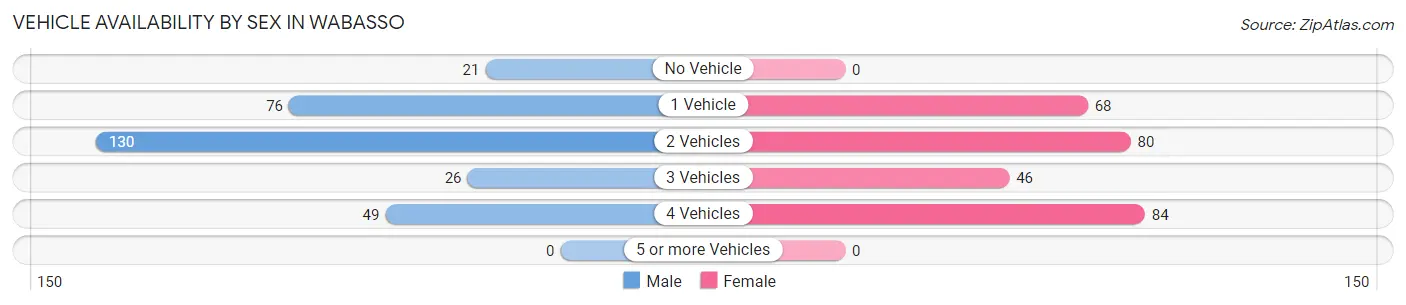
| Vehicles Available | Male | Female |
| No Vehicle | 21 (7.0%) | 0 (0.0%) |
| 1 Vehicle | 76 (25.2%) | 68 (24.5%) |
| 2 Vehicles | 130 (43.0%) | 80 (28.8%) |
| 3 Vehicles | 26 (8.6%) | 46 (16.6%) |
| 4 Vehicles | 49 (16.2%) | 84 (30.2%) |
| 5 or more Vehicles | 0 (0.0%) | 0 (0.0%) |
| Total | 302 (100.0%) | 278 (100.0%) |
Commute Time in Wabasso
The most frequently occuring commute durations in Wabasso are 5 to 9 minutes (132 commuters, 30.3%), 15 to 19 minutes (92 commuters, 21.1%), and 25 to 29 minutes (91 commuters, 20.9%).
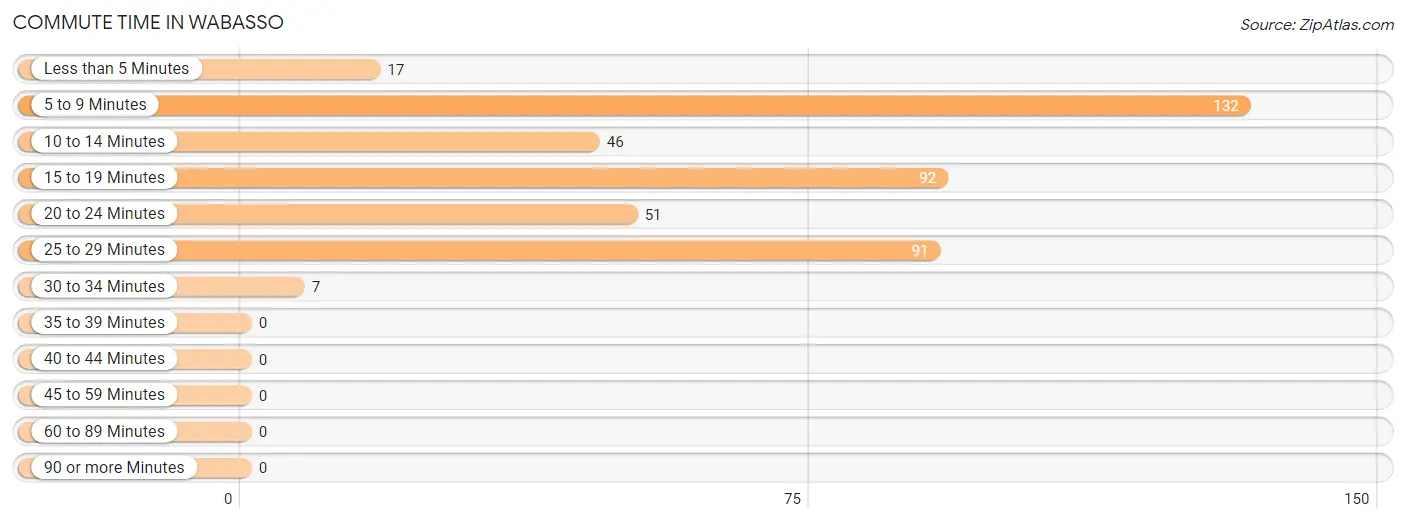
| Commute Time | # Commuters | % Commuters |
| Less than 5 Minutes | 17 | 3.9% |
| 5 to 9 Minutes | 132 | 30.3% |
| 10 to 14 Minutes | 46 | 10.5% |
| 15 to 19 Minutes | 92 | 21.1% |
| 20 to 24 Minutes | 51 | 11.7% |
| 25 to 29 Minutes | 91 | 20.9% |
| 30 to 34 Minutes | 7 | 1.6% |
| 35 to 39 Minutes | 0 | 0.0% |
| 40 to 44 Minutes | 0 | 0.0% |
| 45 to 59 Minutes | 0 | 0.0% |
| 60 to 89 Minutes | 0 | 0.0% |
| 90 or more Minutes | 0 | 0.0% |
Commute Time by Sex in Wabasso
The most common commute times in Wabasso are 25 to 29 minutes (91 commuters, 35.1%) for males and 5 to 9 minutes (79 commuters, 44.6%) for females.
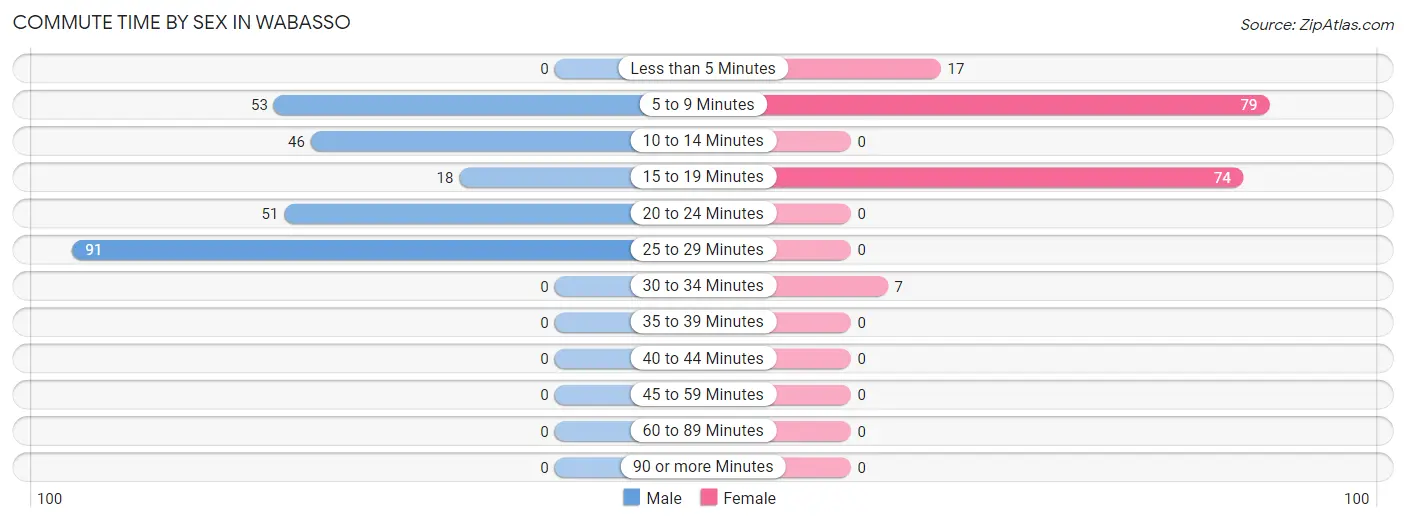
| Commute Time | Male | Female |
| Less than 5 Minutes | 0 (0.0%) | 17 (9.6%) |
| 5 to 9 Minutes | 53 (20.5%) | 79 (44.6%) |
| 10 to 14 Minutes | 46 (17.8%) | 0 (0.0%) |
| 15 to 19 Minutes | 18 (7.0%) | 74 (41.8%) |
| 20 to 24 Minutes | 51 (19.7%) | 0 (0.0%) |
| 25 to 29 Minutes | 91 (35.1%) | 0 (0.0%) |
| 30 to 34 Minutes | 0 (0.0%) | 7 (4.0%) |
| 35 to 39 Minutes | 0 (0.0%) | 0 (0.0%) |
| 40 to 44 Minutes | 0 (0.0%) | 0 (0.0%) |
| 45 to 59 Minutes | 0 (0.0%) | 0 (0.0%) |
| 60 to 89 Minutes | 0 (0.0%) | 0 (0.0%) |
| 90 or more Minutes | 0 (0.0%) | 0 (0.0%) |
Time of Departure to Work by Sex in Wabasso
The most frequent times of departure to work in Wabasso are 8:00 AM to 8:29 AM (146, 56.4%) for males and 10:00 AM to 10:59 AM (79, 44.6%) for females.
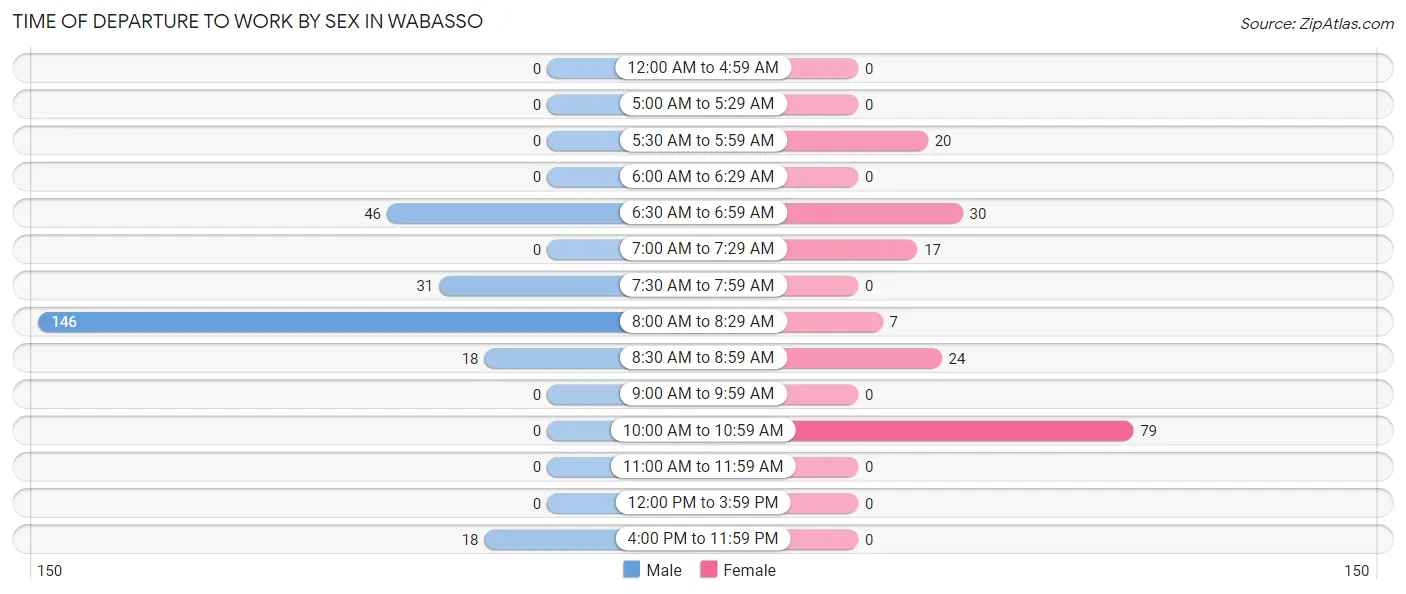
| Time of Departure | Male | Female |
| 12:00 AM to 4:59 AM | 0 (0.0%) | 0 (0.0%) |
| 5:00 AM to 5:29 AM | 0 (0.0%) | 0 (0.0%) |
| 5:30 AM to 5:59 AM | 0 (0.0%) | 20 (11.3%) |
| 6:00 AM to 6:29 AM | 0 (0.0%) | 0 (0.0%) |
| 6:30 AM to 6:59 AM | 46 (17.8%) | 30 (17.0%) |
| 7:00 AM to 7:29 AM | 0 (0.0%) | 17 (9.6%) |
| 7:30 AM to 7:59 AM | 31 (12.0%) | 0 (0.0%) |
| 8:00 AM to 8:29 AM | 146 (56.4%) | 7 (4.0%) |
| 8:30 AM to 8:59 AM | 18 (7.0%) | 24 (13.6%) |
| 9:00 AM to 9:59 AM | 0 (0.0%) | 0 (0.0%) |
| 10:00 AM to 10:59 AM | 0 (0.0%) | 79 (44.6%) |
| 11:00 AM to 11:59 AM | 0 (0.0%) | 0 (0.0%) |
| 12:00 PM to 3:59 PM | 0 (0.0%) | 0 (0.0%) |
| 4:00 PM to 11:59 PM | 18 (7.0%) | 0 (0.0%) |
| Total | 259 (100.0%) | 177 (100.0%) |
Housing Occupancy in Wabasso
Occupancy by Ownership in Wabasso
Of the total 418 dwellings in Wabasso, owner-occupied units account for 277 (66.3%), while renter-occupied units make up 141 (33.7%).
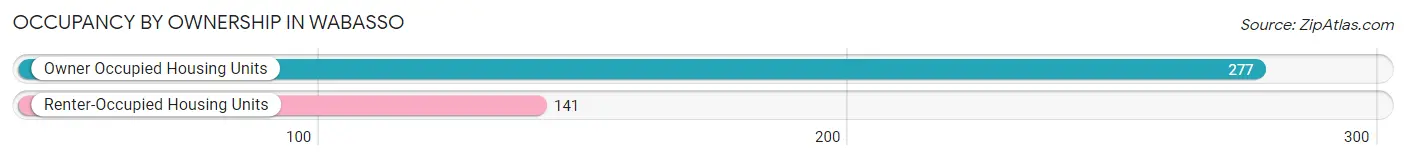
| Occupancy | # Housing Units | % Housing Units |
| Owner Occupied Housing Units | 277 | 66.3% |
| Renter-Occupied Housing Units | 141 | 33.7% |
| Total Occupied Housing Units | 418 | 100.0% |
Occupancy by Household Size in Wabasso
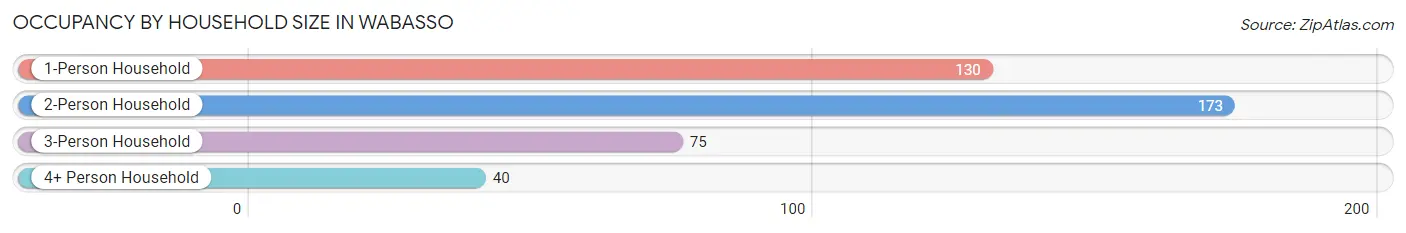
| Household Size | # Housing Units | % Housing Units |
| 1-Person Household | 130 | 31.1% |
| 2-Person Household | 173 | 41.4% |
| 3-Person Household | 75 | 17.9% |
| 4+ Person Household | 40 | 9.6% |
| Total Housing Units | 418 | 100.0% |
Occupancy by Ownership by Household Size in Wabasso
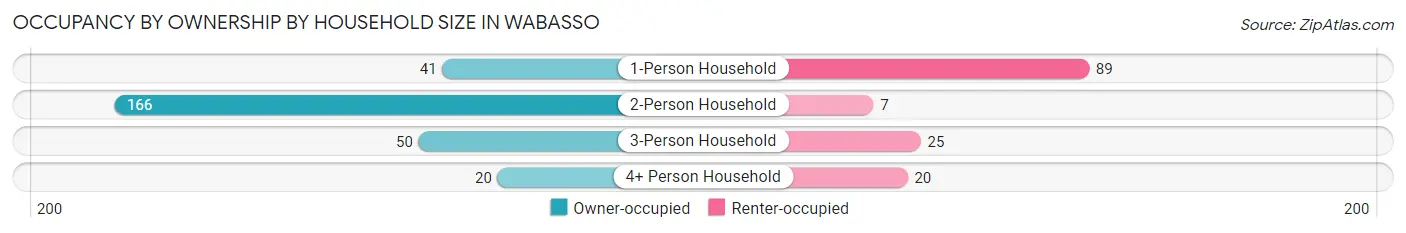
| Household Size | Owner-occupied | Renter-occupied |
| 1-Person Household | 41 (31.5%) | 89 (68.5%) |
| 2-Person Household | 166 (96.0%) | 7 (4.1%) |
| 3-Person Household | 50 (66.7%) | 25 (33.3%) |
| 4+ Person Household | 20 (50.0%) | 20 (50.0%) |
| Total Housing Units | 277 (66.3%) | 141 (33.7%) |
Occupancy by Educational Attainment in Wabasso
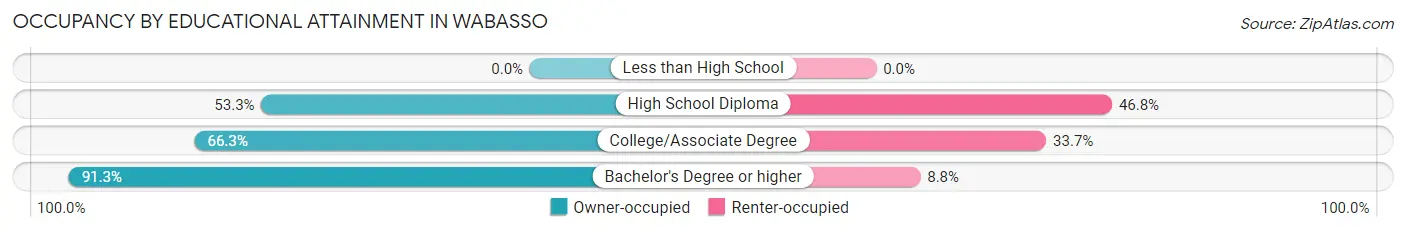
| Household Size | Owner-occupied | Renter-occupied |
| Less than High School | 0 (0.0%) | 0 (0.0%) |
| High School Diploma | 82 (53.2%) | 72 (46.8%) |
| College/Associate Degree | 122 (66.3%) | 62 (33.7%) |
| Bachelor's Degree or higher | 73 (91.2%) | 7 (8.7%) |
Occupancy by Age of Householder in Wabasso
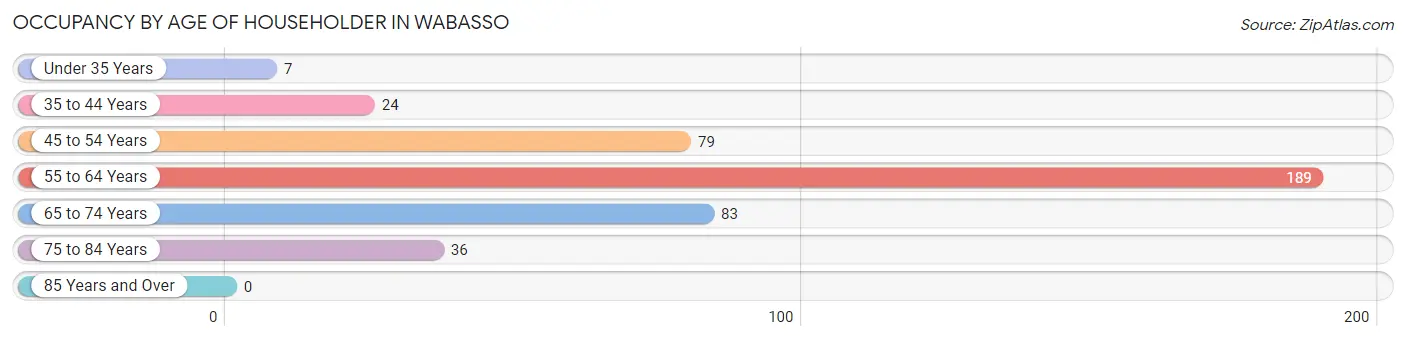
| Age Bracket | # Households | % Households |
| Under 35 Years | 7 | 1.7% |
| 35 to 44 Years | 24 | 5.7% |
| 45 to 54 Years | 79 | 18.9% |
| 55 to 64 Years | 189 | 45.2% |
| 65 to 74 Years | 83 | 19.9% |
| 75 to 84 Years | 36 | 8.6% |
| 85 Years and Over | 0 | 0.0% |
| Total | 418 | 100.0% |
Housing Finances in Wabasso
Median Income by Occupancy in Wabasso
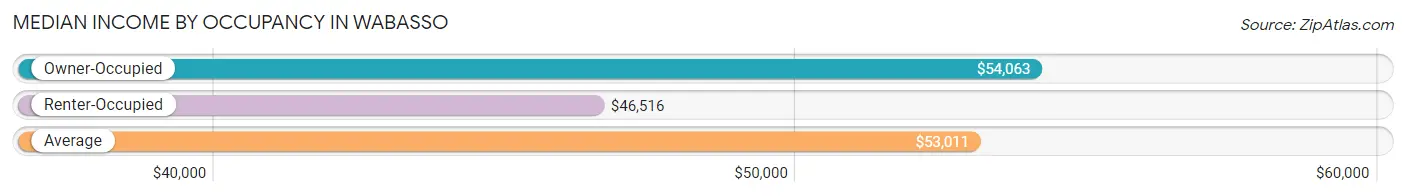
| Occupancy Type | # Households | Median Income |
| Owner-Occupied | 277 (66.3%) | $54,063 |
| Renter-Occupied | 141 (33.7%) | $46,516 |
| Average | 418 (100.0%) | $53,011 |
Occupancy by Householder Income Bracket in Wabasso
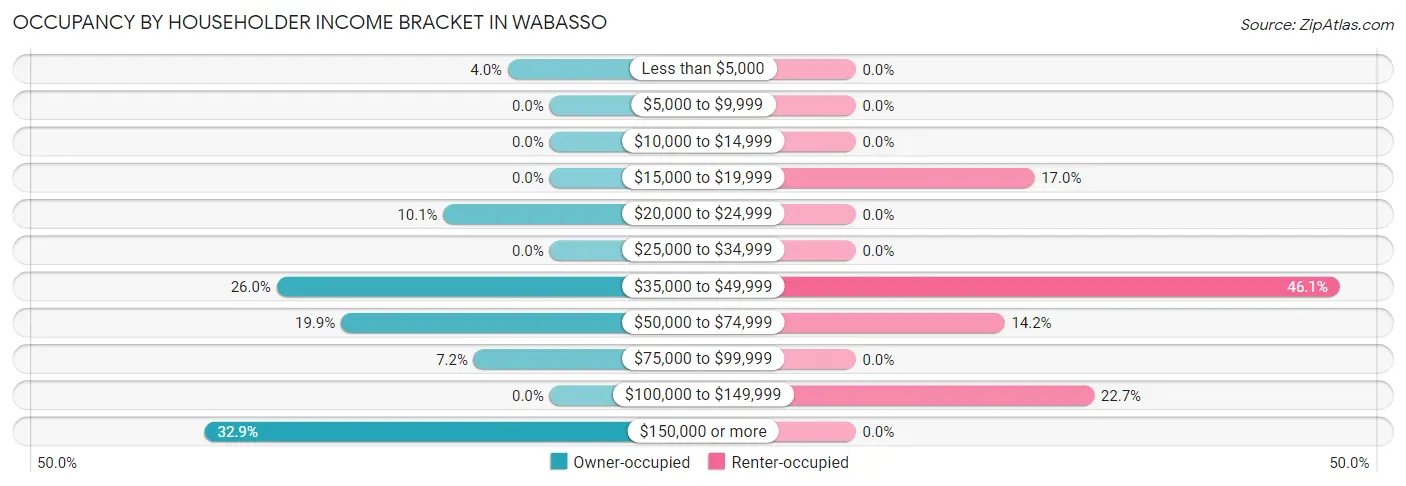
| Income Bracket | Owner-occupied | Renter-occupied |
| Less than $5,000 | 11 (4.0%) | 0 (0.0%) |
| $5,000 to $9,999 | 0 (0.0%) | 0 (0.0%) |
| $10,000 to $14,999 | 0 (0.0%) | 0 (0.0%) |
| $15,000 to $19,999 | 0 (0.0%) | 24 (17.0%) |
| $20,000 to $24,999 | 28 (10.1%) | 0 (0.0%) |
| $25,000 to $34,999 | 0 (0.0%) | 0 (0.0%) |
| $35,000 to $49,999 | 72 (26.0%) | 65 (46.1%) |
| $50,000 to $74,999 | 55 (19.9%) | 20 (14.2%) |
| $75,000 to $99,999 | 20 (7.2%) | 0 (0.0%) |
| $100,000 to $149,999 | 0 (0.0%) | 32 (22.7%) |
| $150,000 or more | 91 (32.9%) | 0 (0.0%) |
| Total | 277 (100.0%) | 141 (100.0%) |
Monthly Housing Cost Tiers in Wabasso
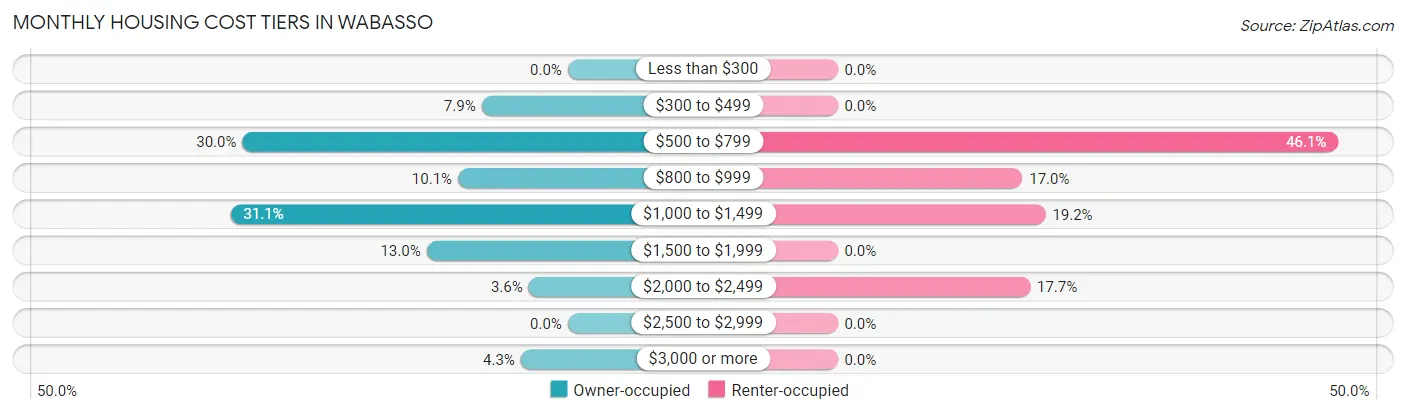
| Monthly Cost | Owner-occupied | Renter-occupied |
| Less than $300 | 0 (0.0%) | 0 (0.0%) |
| $300 to $499 | 22 (7.9%) | 0 (0.0%) |
| $500 to $799 | 83 (30.0%) | 65 (46.1%) |
| $800 to $999 | 28 (10.1%) | 24 (17.0%) |
| $1,000 to $1,499 | 86 (31.0%) | 27 (19.2%) |
| $1,500 to $1,999 | 36 (13.0%) | 0 (0.0%) |
| $2,000 to $2,499 | 10 (3.6%) | 25 (17.7%) |
| $2,500 to $2,999 | 0 (0.0%) | 0 (0.0%) |
| $3,000 or more | 12 (4.3%) | 0 (0.0%) |
| Total | 277 (100.0%) | 141 (100.0%) |
Physical Housing Characteristics in Wabasso
Housing Structures in Wabasso
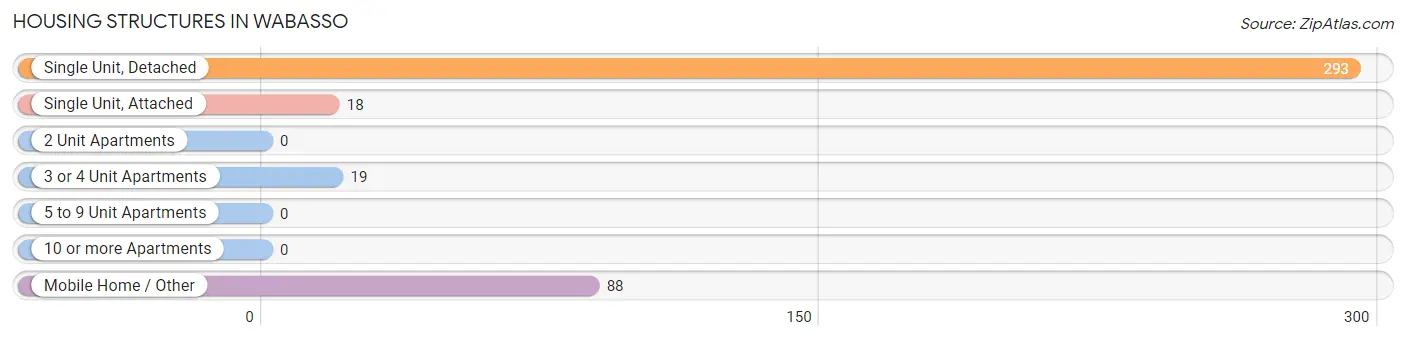
| Structure Type | # Housing Units | % Housing Units |
| Single Unit, Detached | 293 | 70.1% |
| Single Unit, Attached | 18 | 4.3% |
| 2 Unit Apartments | 0 | 0.0% |
| 3 or 4 Unit Apartments | 19 | 4.5% |
| 5 to 9 Unit Apartments | 0 | 0.0% |
| 10 or more Apartments | 0 | 0.0% |
| Mobile Home / Other | 88 | 21.0% |
| Total | 418 | 100.0% |
Housing Structures by Occupancy in Wabasso
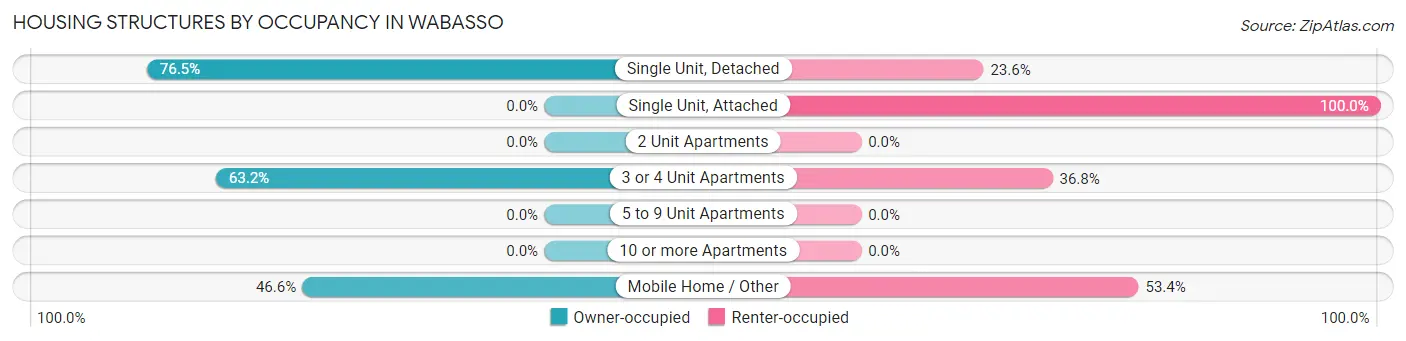
| Structure Type | Owner-occupied | Renter-occupied |
| Single Unit, Detached | 224 (76.4%) | 69 (23.5%) |
| Single Unit, Attached | 0 (0.0%) | 18 (100.0%) |
| 2 Unit Apartments | 0 (0.0%) | 0 (0.0%) |
| 3 or 4 Unit Apartments | 12 (63.2%) | 7 (36.8%) |
| 5 to 9 Unit Apartments | 0 (0.0%) | 0 (0.0%) |
| 10 or more Apartments | 0 (0.0%) | 0 (0.0%) |
| Mobile Home / Other | 41 (46.6%) | 47 (53.4%) |
| Total | 277 (66.3%) | 141 (33.7%) |
Housing Structures by Number of Rooms in Wabasso
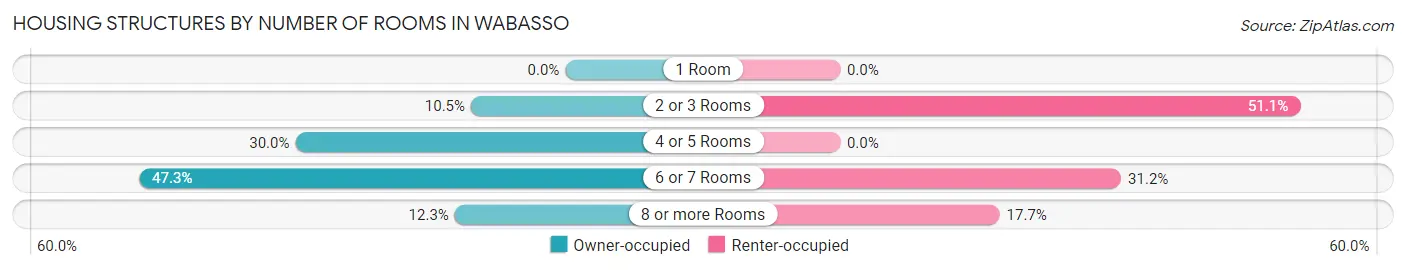
| Number of Rooms | Owner-occupied | Renter-occupied |
| 1 Room | 0 (0.0%) | 0 (0.0%) |
| 2 or 3 Rooms | 29 (10.5%) | 72 (51.1%) |
| 4 or 5 Rooms | 83 (30.0%) | 0 (0.0%) |
| 6 or 7 Rooms | 131 (47.3%) | 44 (31.2%) |
| 8 or more Rooms | 34 (12.3%) | 25 (17.7%) |
| Total | 277 (100.0%) | 141 (100.0%) |
Housing Structure by Heating Type in Wabasso
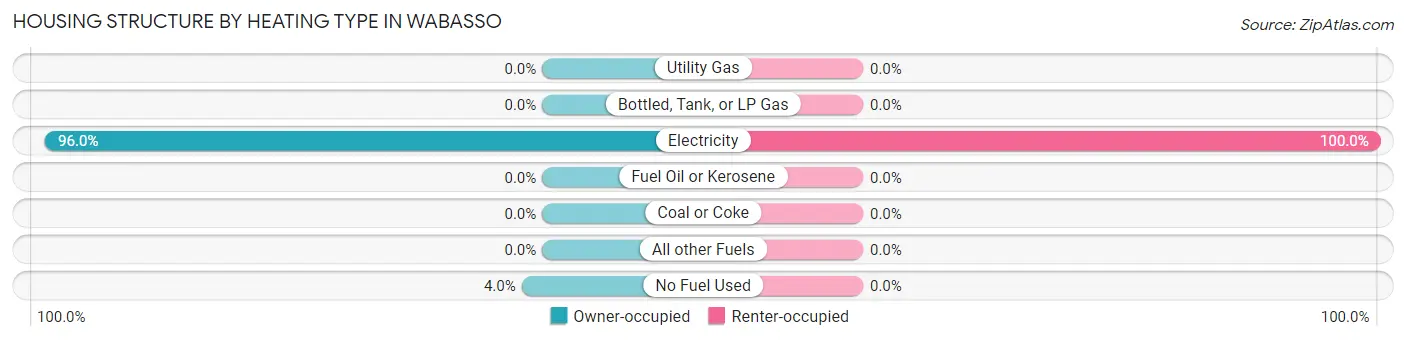
| Heating Type | Owner-occupied | Renter-occupied |
| Utility Gas | 0 (0.0%) | 0 (0.0%) |
| Bottled, Tank, or LP Gas | 0 (0.0%) | 0 (0.0%) |
| Electricity | 266 (96.0%) | 141 (100.0%) |
| Fuel Oil or Kerosene | 0 (0.0%) | 0 (0.0%) |
| Coal or Coke | 0 (0.0%) | 0 (0.0%) |
| All other Fuels | 0 (0.0%) | 0 (0.0%) |
| No Fuel Used | 11 (4.0%) | 0 (0.0%) |
| Total | 277 (100.0%) | 141 (100.0%) |
Household Vehicle Usage in Wabasso
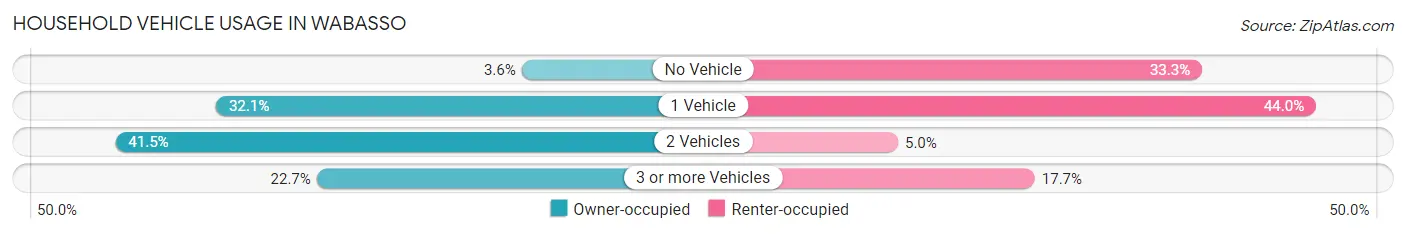
| Vehicles per Household | Owner-occupied | Renter-occupied |
| No Vehicle | 10 (3.6%) | 47 (33.3%) |
| 1 Vehicle | 89 (32.1%) | 62 (44.0%) |
| 2 Vehicles | 115 (41.5%) | 7 (5.0%) |
| 3 or more Vehicles | 63 (22.7%) | 25 (17.7%) |
| Total | 277 (100.0%) | 141 (100.0%) |
Real Estate & Mortgages in Wabasso
Real Estate and Mortgage Overview in Wabasso
| Characteristic | Without Mortgage | With Mortgage |
| Housing Units | 193 | 84 |
| Median Property Value | $443,500 | $0 |
| Median Household Income | - | - |
| Monthly Housing Costs | $891 | $0 |
| Real Estate Taxes | $3,912 | $0 |
Property Value by Mortgage Status in Wabasso
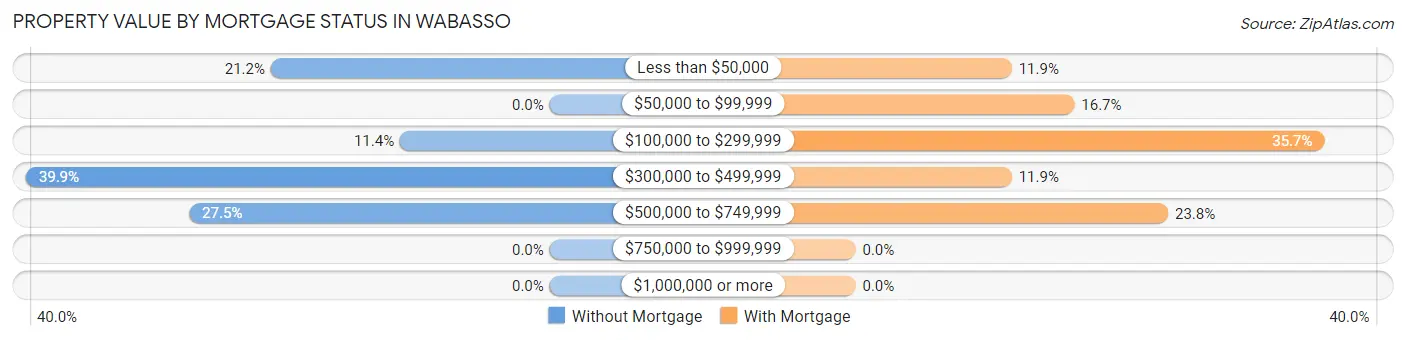
| Property Value | Without Mortgage | With Mortgage |
| Less than $50,000 | 41 (21.2%) | 10 (11.9%) |
| $50,000 to $99,999 | 0 (0.0%) | 14 (16.7%) |
| $100,000 to $299,999 | 22 (11.4%) | 30 (35.7%) |
| $300,000 to $499,999 | 77 (39.9%) | 10 (11.9%) |
| $500,000 to $749,999 | 53 (27.5%) | 20 (23.8%) |
| $750,000 to $999,999 | 0 (0.0%) | 0 (0.0%) |
| $1,000,000 or more | 0 (0.0%) | 0 (0.0%) |
| Total | 193 (100.0%) | 84 (100.0%) |
Household Income by Mortgage Status in Wabasso
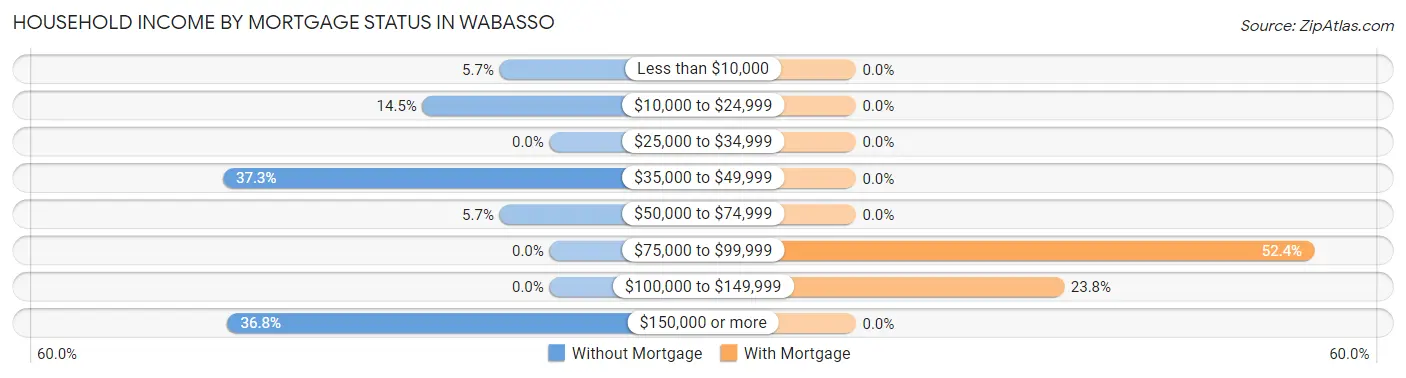
| Household Income | Without Mortgage | With Mortgage |
| Less than $10,000 | 11 (5.7%) | 0 (0.0%) |
| $10,000 to $24,999 | 28 (14.5%) | 0 (0.0%) |
| $25,000 to $34,999 | 0 (0.0%) | 0 (0.0%) |
| $35,000 to $49,999 | 72 (37.3%) | 0 (0.0%) |
| $50,000 to $74,999 | 11 (5.7%) | 0 (0.0%) |
| $75,000 to $99,999 | 0 (0.0%) | 44 (52.4%) |
| $100,000 to $149,999 | 0 (0.0%) | 20 (23.8%) |
| $150,000 or more | 71 (36.8%) | 0 (0.0%) |
| Total | 193 (100.0%) | 84 (100.0%) |
Property Value to Household Income Ratio in Wabasso
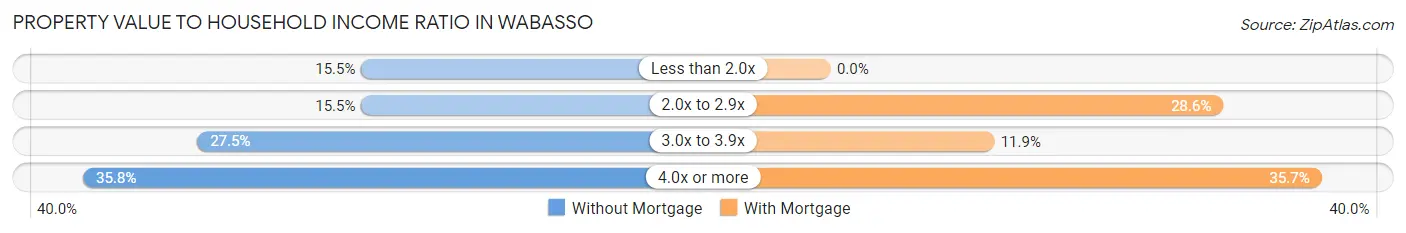
| Value-to-Income Ratio | Without Mortgage | With Mortgage |
| Less than 2.0x | 30 (15.5%) | 0 (0.0%) |
| 2.0x to 2.9x | 30 (15.5%) | 24 (28.6%) |
| 3.0x to 3.9x | 53 (27.5%) | 10 (11.9%) |
| 4.0x or more | 69 (35.7%) | 30 (35.7%) |
| Total | 193 (100.0%) | 84 (100.0%) |
Real Estate Taxes by Mortgage Status in Wabasso
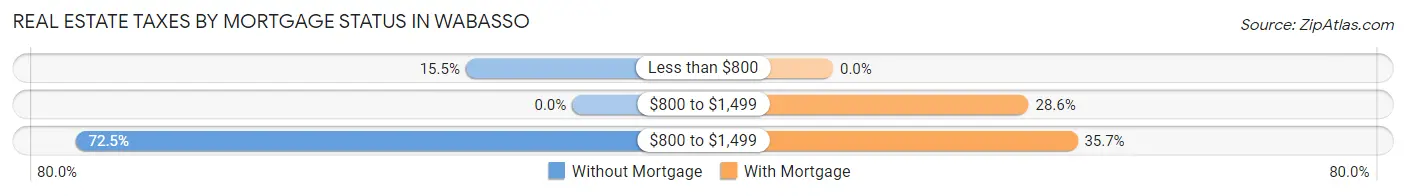
| Property Taxes | Without Mortgage | With Mortgage |
| Less than $800 | 30 (15.5%) | 0 (0.0%) |
| $800 to $1,499 | 0 (0.0%) | 24 (28.6%) |
| $800 to $1,499 | 140 (72.5%) | 30 (35.7%) |
| Total | 193 (100.0%) | 84 (100.0%) |
Health & Disability in Wabasso
Health Insurance Coverage by Age in Wabasso
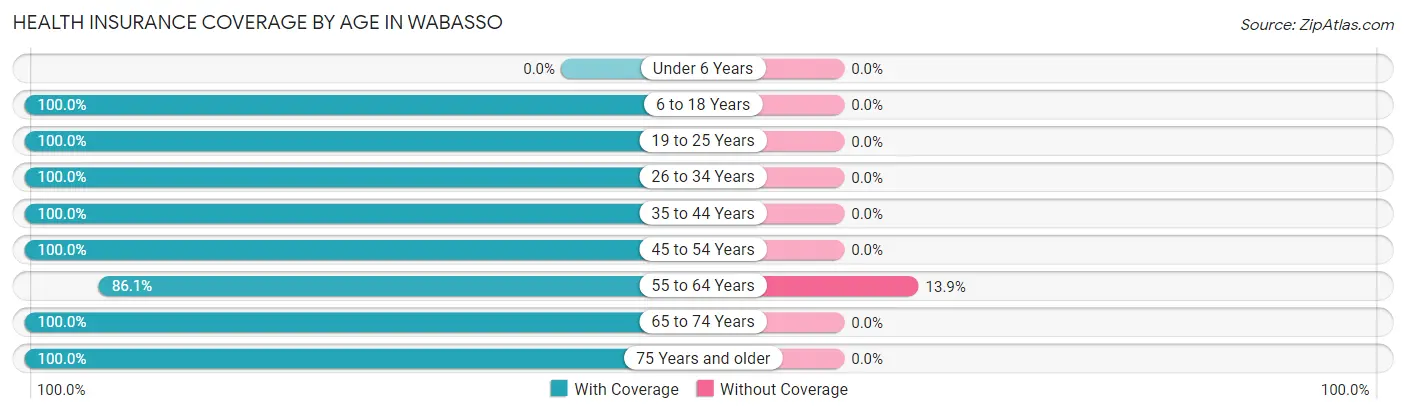
| Age Bracket | With Coverage | Without Coverage |
| Under 6 Years | 0 (0.0%) | 0 (0.0%) |
| 6 to 18 Years | 131 (100.0%) | 0 (0.0%) |
| 19 to 25 Years | 174 (100.0%) | 0 (0.0%) |
| 26 to 34 Years | 28 (100.0%) | 0 (0.0%) |
| 35 to 44 Years | 33 (100.0%) | 0 (0.0%) |
| 45 to 54 Years | 140 (100.0%) | 0 (0.0%) |
| 55 to 64 Years | 286 (86.1%) | 46 (13.9%) |
| 65 to 74 Years | 163 (100.0%) | 0 (0.0%) |
| 75 Years and older | 178 (100.0%) | 0 (0.0%) |
| Total | 1,133 (96.1%) | 46 (3.9%) |
Health Insurance Coverage by Citizenship Status in Wabasso
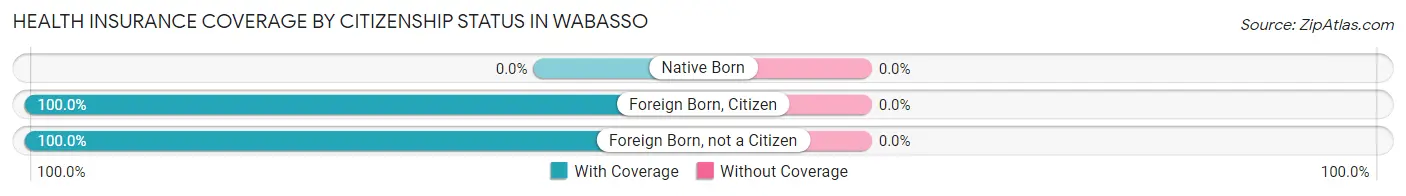
| Citizenship Status | With Coverage | Without Coverage |
| Native Born | 0 (0.0%) | 0 (0.0%) |
| Foreign Born, Citizen | 131 (100.0%) | 0 (0.0%) |
| Foreign Born, not a Citizen | 174 (100.0%) | 0 (0.0%) |
Health Insurance Coverage by Household Income in Wabasso
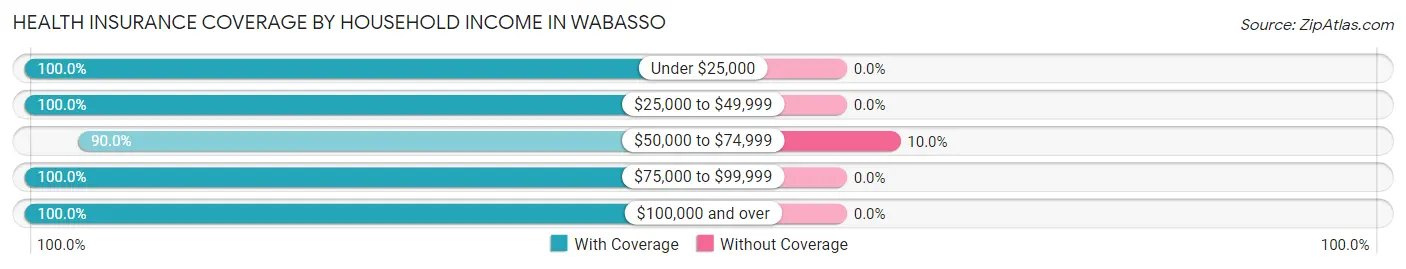
| Household Income | With Coverage | Without Coverage |
| Under $25,000 | 94 (100.0%) | 0 (0.0%) |
| $25,000 to $49,999 | 196 (100.0%) | 0 (0.0%) |
| $50,000 to $74,999 | 412 (90.0%) | 46 (10.0%) |
| $75,000 to $99,999 | 92 (100.0%) | 0 (0.0%) |
| $100,000 and over | 339 (100.0%) | 0 (0.0%) |
Public vs Private Health Insurance Coverage by Age in Wabasso
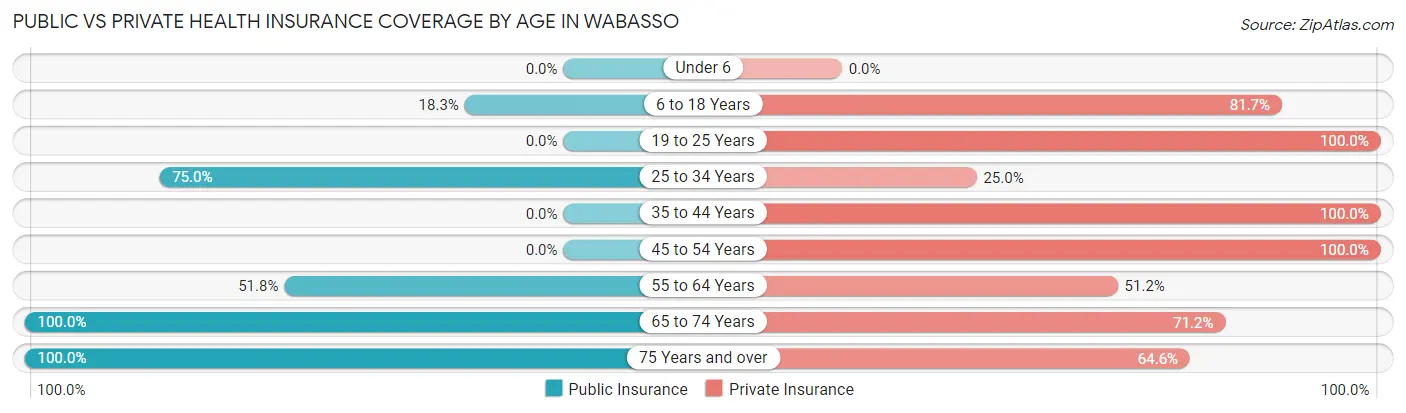
| Age Bracket | Public Insurance | Private Insurance |
| Under 6 | 0 (0.0%) | 0 (0.0%) |
| 6 to 18 Years | 24 (18.3%) | 107 (81.7%) |
| 19 to 25 Years | 0 (0.0%) | 174 (100.0%) |
| 25 to 34 Years | 21 (75.0%) | 7 (25.0%) |
| 35 to 44 Years | 0 (0.0%) | 33 (100.0%) |
| 45 to 54 Years | 0 (0.0%) | 140 (100.0%) |
| 55 to 64 Years | 172 (51.8%) | 170 (51.2%) |
| 65 to 74 Years | 163 (100.0%) | 116 (71.2%) |
| 75 Years and over | 178 (100.0%) | 115 (64.6%) |
| Total | 558 (47.3%) | 862 (73.1%) |
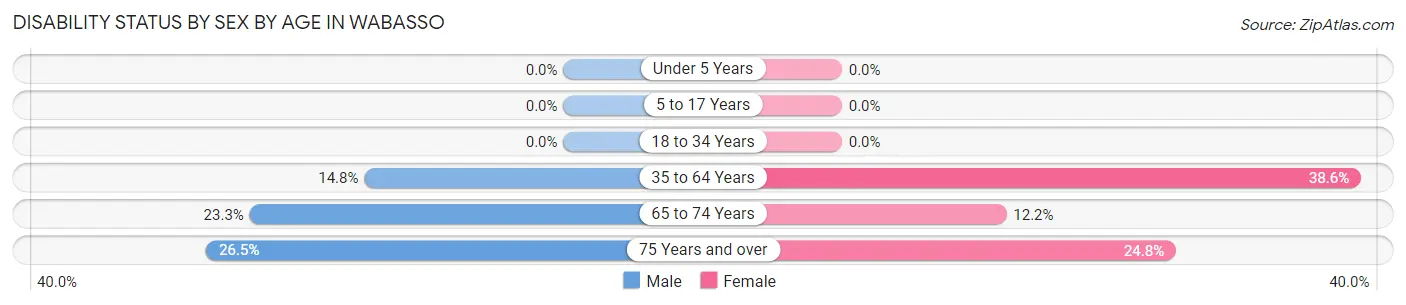
Disability Status by Sex by Age in Wabasso
| Age Bracket | Male | Female |
| Under 5 Years | 0 (0.0%) | 0 (0.0%) |
| 5 to 17 Years | 0 (0.0%) | 0 (0.0%) |
| 18 to 34 Years | 0 (0.0%) | 0 (0.0%) |
| 35 to 64 Years | 34 (14.8%) | 106 (38.6%) |
| 65 to 74 Years | 17 (23.3%) | 11 (12.2%) |
| 75 Years and over | 13 (26.5%) | 32 (24.8%) |
Disability Class by Sex by Age in Wabasso
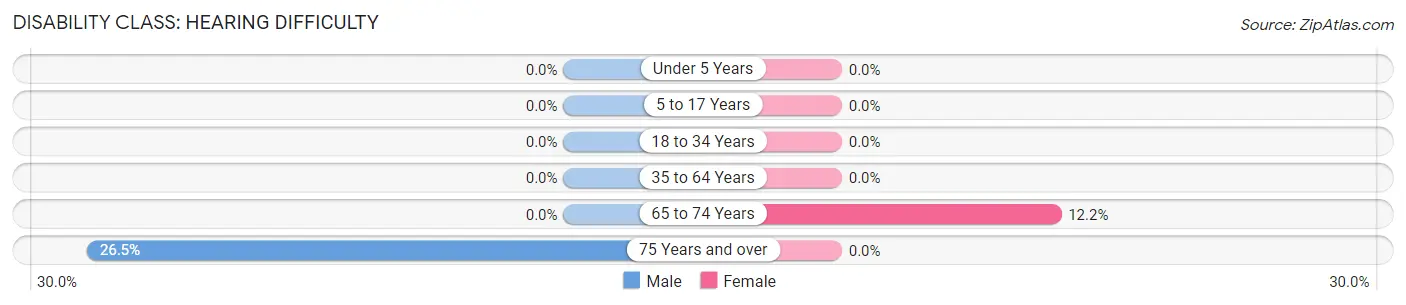
Disability Class: Hearing Difficulty
| Age Bracket | Male | Female |
| Under 5 Years | 0 (0.0%) | 0 (0.0%) |
| 5 to 17 Years | 0 (0.0%) | 0 (0.0%) |
| 18 to 34 Years | 0 (0.0%) | 0 (0.0%) |
| 35 to 64 Years | 0 (0.0%) | 0 (0.0%) |
| 65 to 74 Years | 0 (0.0%) | 11 (12.2%) |
| 75 Years and over | 13 (26.5%) | 0 (0.0%) |
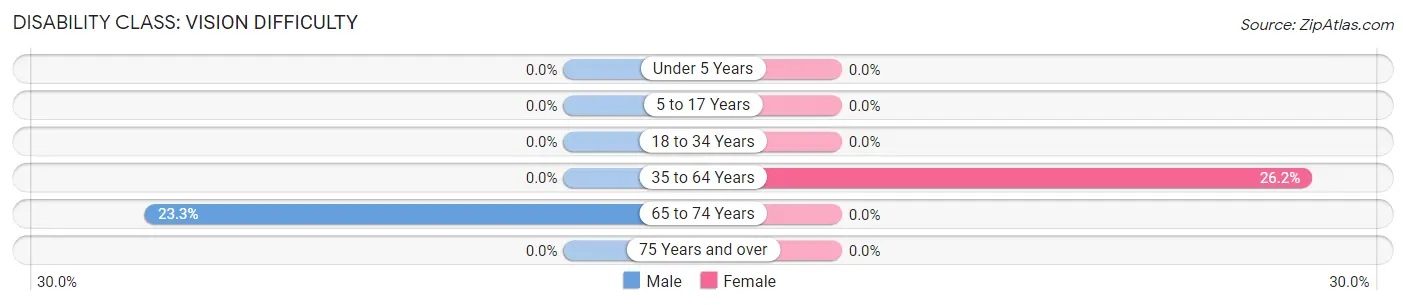
Disability Class: Vision Difficulty
| Age Bracket | Male | Female |
| Under 5 Years | 0 (0.0%) | 0 (0.0%) |
| 5 to 17 Years | 0 (0.0%) | 0 (0.0%) |
| 18 to 34 Years | 0 (0.0%) | 0 (0.0%) |
| 35 to 64 Years | 0 (0.0%) | 72 (26.2%) |
| 65 to 74 Years | 17 (23.3%) | 0 (0.0%) |
| 75 Years and over | 0 (0.0%) | 0 (0.0%) |
Disability Class: Cognitive Difficulty
| Age Bracket | Male | Female |
| 5 to 17 Years | 0 (0.0%) | 0 (0.0%) |
| 18 to 34 Years | 0 (0.0%) | 0 (0.0%) |
| 35 to 64 Years | 0 (0.0%) | 0 (0.0%) |
| 65 to 74 Years | 0 (0.0%) | 0 (0.0%) |
| 75 Years and over | 0 (0.0%) | 0 (0.0%) |
Disability Class: Ambulatory Difficulty
| Age Bracket | Male | Female |
| 5 to 17 Years | 0 (0.0%) | 0 (0.0%) |
| 18 to 34 Years | 0 (0.0%) | 0 (0.0%) |
| 35 to 64 Years | 34 (14.8%) | 106 (38.6%) |
| 65 to 74 Years | 0 (0.0%) | 0 (0.0%) |
| 75 Years and over | 0 (0.0%) | 32 (24.8%) |
Disability Class: Self-Care Difficulty
| Age Bracket | Male | Female |
| 5 to 17 Years | 0 (0.0%) | 0 (0.0%) |
| 18 to 34 Years | 0 (0.0%) | 0 (0.0%) |
| 35 to 64 Years | 34 (14.8%) | 35 (12.7%) |
| 65 to 74 Years | 0 (0.0%) | 0 (0.0%) |
| 75 Years and over | 0 (0.0%) | 0 (0.0%) |
Technology Access in Wabasso
Computing Device Access in Wabasso
| Device Type | # Households | % Households |
| Desktop or Laptop | 347 | 83.0% |
| Smartphone | 327 | 78.2% |
| Tablet | 300 | 71.8% |
| No Computing Device | 71 | 17.0% |
| Total | 418 | 100.0% |
Internet Access in Wabasso
| Internet Type | # Households | % Households |
| Dial-Up Internet | 0 | 0.0% |
| Broadband Home | 315 | 75.4% |
| Cellular Data Only | 10 | 2.4% |
| Satellite Internet | 24 | 5.7% |
| No Internet | 93 | 22.3% |
| Total | 418 | 100.0% |
Wabasso Summary
Wabasso is a small unincorporated community located in Indian River County, Florida. It is situated on the Indian River Lagoon, just south of Sebastian Inlet. The population of Wabasso was estimated to be 1,845 in 2019.
History
The area now known as Wabasso was originally inhabited by the Ais Indians, who were part of the Seminole tribe. The name Wabasso is derived from the Ais Indian word for “rabbit”. The area was first settled by Europeans in the late 19th century. The first post office was established in 1887.
In the early 20th century, Wabasso was a popular destination for fishing and hunting. The area was also known for its citrus groves and vegetable farms. In the 1950s, Wabasso began to develop as a residential community. The population grew steadily throughout the decades, and by the 2000s, Wabasso had become a popular destination for retirees.
Geography
Wabasso is located in Indian River County, Florida. It is situated on the Indian River Lagoon, just south of Sebastian Inlet. The area is characterized by flat terrain and sandy soil. The climate is subtropical, with hot, humid summers and mild winters.
Economy
The economy of Wabasso is largely based on tourism and agriculture. The area is known for its fishing and hunting opportunities, as well as its citrus groves and vegetable farms. The area is also home to several small businesses, including restaurants, retail stores, and marinas.
Demographics
As of 2019, the population of Wabasso was estimated to be 1,845. The population is predominantly white (90.2%), with a small percentage of African Americans (4.2%) and Hispanics (3.3%). The median household income is $45,945, and the median age is 54.
Conclusion
Wabasso is a small unincorporated community located in Indian River County, Florida. It is situated on the Indian River Lagoon, just south of Sebastian Inlet. The population of Wabasso was estimated to be 1,845 in 2019. The area is characterized by flat terrain and sandy soil, and the climate is subtropical. The economy of Wabasso is largely based on tourism and agriculture, and the population is predominantly white.
Common Questions
What is Per Capita Income in Wabasso?
Per Capita income in Wabasso is $35,544.
What is the Median Household income in Wabasso?
Median Household Income in Wabasso is $53,011.
What is Income or Wage Gap in Wabasso?
Income or Wage Gap in Wabasso is 14.5%.
Women in Wabasso earn 85.5 cents for every dollar earned by a man.
What is Inequality or Gini Index in Wabasso?
Inequality or Gini Index in Wabasso is 0.41.
What is the Total Population of Wabasso?
Total Population of Wabasso is 1,179.
What is the Total Male Population of Wabasso?
Total Male Population of Wabasso is 504.
What is the Total Female Population of Wabasso?
Total Female Population of Wabasso is 675.
What is the Ratio of Males per 100 Females in Wabasso?
There are 74.67 Males per 100 Females in Wabasso.
What is the Ratio of Females per 100 Males in Wabasso?
There are 133.93 Females per 100 Males in Wabasso.
What is the Median Population Age in Wabasso?
Median Population Age in Wabasso is 56.8 Years.
What is the Average Family Size in Wabasso
Average Family Size in Wabasso is 3.6 People.
What is the Average Household Size in Wabasso
Average Household Size in Wabasso is 2.8 People.
How Large is the Labor Force in Wabasso?
There are 591 People in the Labor Forcein in Wabasso.
What is the Percentage of People in the Labor Force in Wabasso?
56.4% of People are in the Labor Force in Wabasso.
What is the Unemployment Rate in Wabasso?
Unemployment Rate in Wabasso is 1.9%.